Arizona Agency NCIC Numbers

This info will be only of interest for those working with the ADOT Data Safety Mart database.

There are a couple of places on the ACR form for NCIC numbers. That stands for National Crime Information Center; and the actual number in question apparently is called an Originating Agency Identifier (ORI) and it’s keeper is the FBI. Below I will refer to this number only as the “NCIC number”.

I found it surprisingly difficult to find a list. The only place I found it was in a 12 year old(!) AZ Crash Manual (“Manual of Instructions for use with State of Arizona Traffic Accident Report Forms” published by ADOT dated December 2000), so the info regarding Agency name should be suspect.

It is plain to see that some of it is easily verifyable  and correlates to any of the “big” cities/jurisdictions: Phoenix PD is 0723, DPS is 0799, Tucson PD is 1003, etc. Beyond a couple of dozen, though, things get pretty sketchy.

Of more interest is the meaning of the distinction between data fields ExtendedNcic, and OfficerNcic — the field on the ACR is marked simply NCIC No. (Block 1e), which i imagine maps to ExtendedNcic; however I can’t find a block on the ACR that might correspond to OfficerNcic. They are usually, but by no means always, the same. There’s another thing called Officer ID No., Block 1f, but that maps to OfficerID in table incident.

This info is also in my famous catch-all spreadsheet adsm.xls; and will undoubtedly either turn into enumerations, or probably its own table.


Arizona NCIC Numbers
National Crime Information Center number is a code that uniquely identifies each law enforcement agency. Numbers are assigned by the Federal Bureau of Investigation. (See pages 66 through 68 [of the year 2000 version of AZ Crash Manual] for a complete list of Arizona NCIC Numbers.)
ExtendedNcic, OfficerNcic’s value/count data from ADOT safety data mart year 2010. Agency name list from pages 66 -68 of the year 2000 version of AZ Crash Manual
ExtendedNcic OfficerNcic From 2000 AZ Crash Manual
value count value count agency name value
100 474 100 40 Apache County S.O. 100
101 28 101 28 Eagar 101
103 18 103 18 St. Johns 103
105 12 105 10 Springerville 105
Whitemountain Apache Res. (Apache) 162
189 73 Navajo Reservation (Apache) 189
200 693 200 224 Cochise County S.O. 200
201 89 201 55 Benson 201
203 4 203 1 Bisbee 203
205 41 205 37 Douglas 205
207 7 207 8 Huachuca City 207
209 756 209 763 Sierra Vista 209
211 1 Tombstone 211
213 39 213 32 Willcox 213
300 1539 300 223 Coconino County S.O. 300
301 1909 301 1762 Flagstaff 301
302 1 Hualapai Reservation (Coconino) 302
303 6 Fredonia 303
307 97 307 43 Williams 307
308 21 308 21 Page 308
310 195 310 197 Sedona 310
Hopi Reservation (Coconino) 365
389 34 Navajo Reservation (Coconino) 389
Northern Arizona University 397
400 484 400 134 Gila County S.O. 400
401 172 401 178 Globe 401
403 2 403 1 Hayden 403
405 13 405 13 Miami 405
406 142 406 139 Payson 406
407 1 489 4 Winkelman 407
Whitemountain Apache Res. (Gila) 465
San Carlos Reservation (Gila) 489
500 124 500 38 Graham County S.O. 500
501 3 Pima 501
503 105 503 95 Safford 503
505 45 505 49 Thatcher 505
San Carlos Reservation (Graham) 562
600 60 600 13 Greenlee County S.O. 600
601 6 601 3 Clifton 601
603 4 Duncan 603
700 5242 700 3036 Maricopa County S.O. 700
701 1044 701 890 Avondale 701
703 405 703 256 Buckeye 703
704 56 Cave Creek 704
705 3516 705 3007 Chandler 705
707 321 707 311 El Mirage 707
709 20 Gila Bend 709
711 2378 711 2250 Gilbert 711
713 4822 713 4492 Glendale 713
715 939 715 635 Goodyear 715
Ft. McDowell Reservation 716
717 6130 717 4744 Mesa 717
719 193 719 131 Paradise Valley 719
721 2237 721 1855 Peoria 721
723 29065 723 21442 Phoenix 723
725 3529 725 3329 Scottsdale 725
727 1027 727 904 Surprise 727
729 6659 729 4084 Tempe 729
731 366 731 237 Tolleson 731
733 93 733 89 Wickenburg 733
735 13 Youngtown 735
739 300 Guadalupe 739
744 3
753 41
755 116
756 97 Fountain Hills 756
760 15 Carefree 760
Gila Bend Reservation 762
Tohono O’Odham Res. (Maricopa) 763
Gila River reservation (Maricopa) 764
789 1 Salt River Reservation 789
Arizona State University 797
799 25587 Dept. of Public Safety 799
800 1140 800 326 Mohave County S.O. 800
801 537 801 478 Kingman 801
804 629 804 632 Hualapai Reservation (Mohave) 802
805 683 805 684 Lake Havasu City 804
806 18 806 18 Bullhead City 805
Colorado City 806
Kaibab-Paiute Reservation 860
862 3 Ft.Mohave Reservation 862
900 647 900 141 Navajo County S.O. 900
901 60 901 41 Holbrook 901
902 19 Hopi Reservation (Navajo) 902
903 164 903 167 Show Low 903
905 64 905 81 Snowflake 905
907 19 Taylor 907
909 134 909 117 Winslow 909
913 118 913 124 Pinetop/Lakeside 913
962 72 Navajo Reservation (Navajo) 962
989 2 Whitemountain Apache Res. (Navajo) 989
1000 4424 1000 3324 Pima County S.O. 1000
1001 70 1001 69 South Tucson 1001
1003 9718 1003 9058 Tucson 1003
1004 192 1004 157 Sahuarita / Green Valley (both same code??) 1004
1007 454 1007 462 Oro Valley 1007
1009 916 1009 679 Marana 1009
San Xavier Reservation 1062
1089 220 Tohono O’Odham Res. (Pima) 1089
1097 117 University of Arizona 1097
1100 1779 1100 703 Pinal County S.O. 1100
1101 853 1101 796 Casa Grande 1101
1103 172 1103 179 Coolidge 1103
1105 149 1105 97 Eloy 1105
1107 81 1107 111 Florence 1107
1109 5 1109 4 Kearney 1109
1111 4 1111 4 Mammoth 1111
1112 2 1112 1 Superior 1112
1113 417 1113 377 Apache Junction 1113
1117 215 1117 211
1164 7 Tohono O’Odham Res. (Pinal) 1164
Maricopa Reservation 1165
1189 345 Gila River Reservation (Pinal) 1189
Central Arizona College 1197
1200 294 1200 75 Santa Cruz County S.O. 1200
1201 342 1201 313 Nogales 1201
Patagonia 1203
1300 1378 1300 283 Yavapai County S.O. 1300
1301 1 1301 1 Clarkdale 1301
1303 244 1303 237 Cottonwood 1303
1305 6 1305 5 Jerome 1305
1307 760 1307 749 Prescott 1307
1311 539 1311 536 Prescott Valley 1311
1312 87 1312 87 Chino Valley 1312
1313 92 1313 72 Camp Verde 1313
1314 1
1358 11
Hualapai Reservation (Yavapai) 1363
1400 716 1400 484 Yuma County S.O. 1400
1403 26 1403 31 Somerton 1403
1405 1891 1405 1849 Yuma 1405
1407 7 Wellton 1407
1408 137 1408 139 San Luis 1408
1410 5
1497 1 Arizona Western College 1497
1500 330 1500 32 La Paz County S.O. 1500
1501 33 1501 31 Parker 1501
1503 35 1503 18 Quartzite 1503
Colorado River Reservation 1506
Sums → 106301 106301
Below are listed Federal Parks and Monuments, and US Military – it is not clear how, or even if, these codes (from 2000) map to the Adot data, which is all numeric; and perhaps doesn’t even cover “federal” investigations?
Canyon De Chelly National Monument I007
Casa Grande Ruins National Monument I012
Chiricauha National Monument I013
Glen Canyon National Monument I003
Montezuma Castle National Monument I014
Navajo National Monument I009
Organ Pipe Cactus National Monument I015
Petrified Forest National Park I004
Saguaro National Monument I005
Sunset Crater National Monument I010
Tonto National Monument I016
Tumacacori National Monument I017
Tuzigoot National Monument I018
Walnut Canyon National Monument I019
Wupatki National Monument I011
Davis Monthan AFB F001
Ft. Huachuca Army Base USA0
Luke AFB F003
Yuma Proving Grounds Army Base SA02 SA02

Most at Fault vs. NCIC

Most at Fault is defined in the Arizona Crash Form Manual

Traffic Unit #1 is the vehicle, pedestrian, pedalcycle that caused the collision or was most at fault.

Police determine or decide who is most at fault, by assigning #1 to that person/operator when filling out the Arizona Crash Report; note that there is no defined way to indicate that investigators find it impossible to determine fault; there must be a unit #1.

(The stats quoted can be found in this comment below)
It can be illuminating to study who, the bicyclist or the motorist, was most at fault (MaF) in a Bike-MV collision. All things being equal, we would expect a 50:50 split, because in the vast majority of collisions there is one bicycle operator, and one MV operator.

The MaF data is available in the yearly collision database from ADOT, a.k.a. the ASDM; the vehicle/person/bicyclist listed as Unit #1 is always the MaF, in the determination of the investigating officer.

Reassuringly, overall the MaF rates are indeed fairly close to 50:50 — for example, the seven year period 2009-2015 the split was 51:49, indicating bicyclists were every so slightly more likely to be found at fault that the driver they collided with. Deviations from this nominal rate might indicate something is amiss; perhaps bicyclists in one community are more likely to break the law, or perhaps police are misinterpreting laws in someone’s favor…

The NCICs associated with the city of Phoenix has a particularly high bicyclist MaF rate: e.g. 68% in 2010 — compare this to, e.g. Scottsdale where it was only 48%. I find it pretty unlikely that bicyclists in Phoenix behave significantly different than Scottsdale; though without looking at a lot of ACRs it’s not possible to tell. On the other hand, 2010 seems to have been anomalously high that year, 2011 and 2012 were 61 and 60%, respectively; so perhaps just a data glitch. On the other hand Tempe, at 68% in 2012, and seems persistantly somewhat high. Yuma, a small city, had a persistently very high bicyclist MaF rate, as high as 80%!, this may be changing after the local ordiance restricted & clarified sidewalk use rules in 2015.

Here are some queries; note that similar results are used using either OfficerNcic as ExtendedNcic. The first is very fancy, computing the percentages and everything!

SELECT sum(atfault)/count(1), Name, sum(atfault), count(1) FROM LOVNcic, (SELECT ExtendedNcic, u.eUnitType='PEDALCYCLIST' atfault FROM 2012_incident i, 2012_unit u WHERE i.IncidentID=u.IncidentID AND EXISTS (SELECT 1 FROM 2012_unit u2 WHERE u2.IncidentID=i.IncidentID AND u2.eUnitType='PEDALCYCLIST') AND UnitNumber=1) x WHERE ID=ExtendedNcic GROUP BY ExtendedNcic HAVING count(1)>20 ORDER BY 1;

Here is how to select the total number of bike crashes by ncic, and then the number of those where bicyclist is MaF

SELECT ExtendedNcic,count(1) FROM 2012_incident i WHERE EXISTS (SELECT 1 FROM 2012_unit u WHERE u.IncidentID=i.IncidentID AND u.eUnitType IN ('PEDALCYCLIST')) GROUP BY 1 ORDER BY 1 ASC;
SELECT ExtendedNcic,count(1) FROM 2012_incident i WHERE EXISTS (SELECT 1 FROM 2012_unit u WHERE u.IncidentID=i.IncidentID AND u.eUnitType IN ('PEDALCYCLIST') AND u.UnitNumber=1 ) GROUP BY 1 ORDER BY 1 ASC;

[civil suit finally settled] Rumsey guilty of manslaughter

[ UPDATE May 2012: Final awards in Jose Rincon’s civil lawsuit after a trip to appellate court; azstarnet.com (though their links seem to regularly go dead). Note that the original award of $13 was the LARGEST judgement ever against the city:

…Chuy’s settled before the February 2010 civil trial for an undisclosed sum. During the trial, jurors were told that a city engineer had abandoned plans to add five feet of asphalt to the roadway during an improvement project, creating a large offset in the lanes on either side of Vozack Lane, just east of Harrison. As a result, Rumsey ended up in the bike lane when her lane ended and she tried to merge.

The jury decided Rumsey, the city of Tucson and Chuy’s were equally responsible and awarded $40 million to the Rincon family. The city’s $13 million share was the largest individual judgment ever against the city. The city appealed, and Pima County Superior Court Judge Kenneth Lee denied the motion for a new trial but granted the defendants’ request for a reduced judgment, slashing the judgment to $12 million.

The city then went to the Arizona Court of Appeals, and it decided in March 2011 that the case should be retried. The Rincons settled with both Rumsey and the city recently.

The settlement with Rumsey is confidential; the settlement with the city specifically states the city was making “no admission of liability, culpability or fault, either by expression or implication.” …. Back when Lee reduced the $40 million judgment, Rincon said he and his wife had agreed to settle the lawsuit for $950,000 before trial, but the city refused. He bemoaned the fact that because the public didn’t know the city hadn’t accepted the settlement offer, residents were under the impression he and his wife were “money-grubbers.”…

The city’s appeal is online at justia.com RINCON v. RUMSEY, CITY OF TUCSON, contains some interesting stuff. (it should also be online via court-of-appeals div 2 website, but i haven’t looked for it there). Note that the superior-court appeal upheld the trial judge; while the court of appeals found the trial court judge (and thus the superior court appeals judge) erred.

]

Glenda Rumsey was found guilty of manslaughter in the death of Tucson teenager Jose Rincon.  (see here for a roundup of types of murder). Like many drunk drivers, she also tried to run. Continue reading “[civil suit finally settled] Rumsey guilty of manslaughter”

IIHS: SUVs Becoming Less Deadly

It used to be that SUVs were both more deadly to others, because of something dubbed poor “crash compatibility”, and not particularly safe (or perhaps i should say: not as safe as they could have been) for their own occupants due to a propensity to roll over; see this 2005 IIHS study that looked at 1999-2002 model years. It was a bit of a lose-lose proposition.

The latest version of looking at the risk of dying in any particular car, which covers model year 2005-2008, shows a marked decrease in SUV rollover deaths, presumably due to design changes in SUVs the most prominent being stability control “Recently calculated driver death rates for 2005-08 models show that drivers of SUVs are among the least likely to die in a crash. That change is due largely to ESC (Electronic Stability Control)”

Who is your Crash Partner?

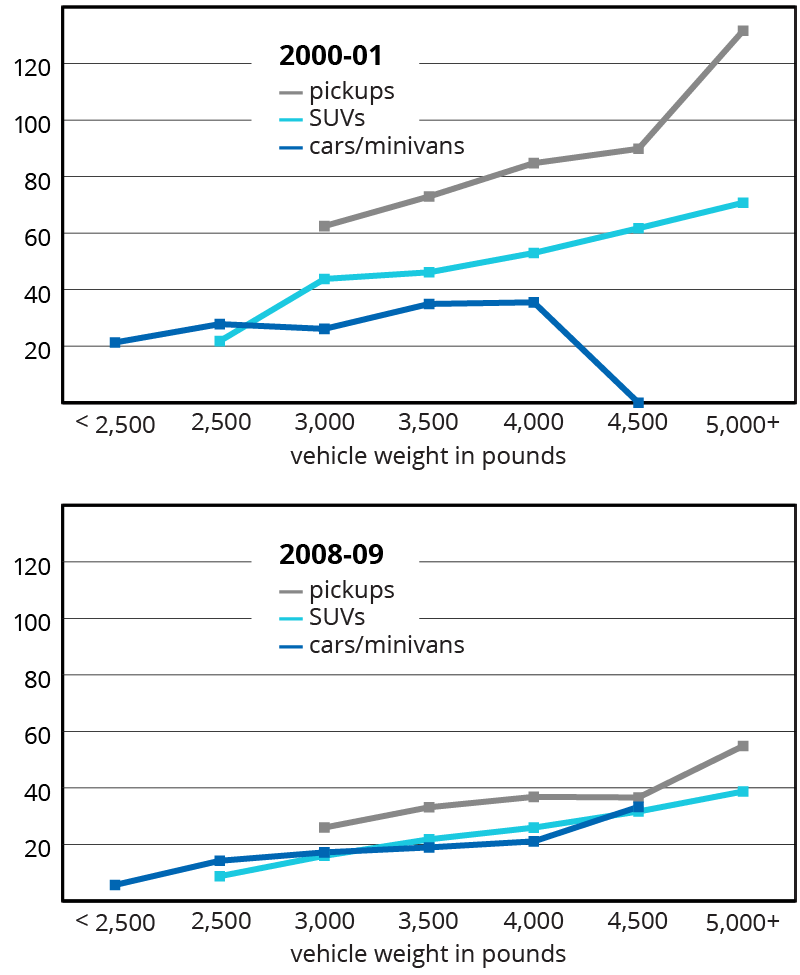
Those studies look only at the risk of death to the driver of any particular vehicle — without regard to any other factors of the collision. It has long been known that SUVs pose a higher risk to others, because of their rigid frame design, which is also rides higher; in a collision with a car, particularly a t-bone, the rigid frame tends to slice into the car, disproportionately killing the car occupants. Happily, design changes made to SUVs have helped the sit

uation, to the point where similar weight vehicles, whether they are SUVs or cars, have similar risk of death.

“Whether you’re in an SUV or just sharing the road with one,” Nolan says, “recent improvements to these vehicles are making you safer.”

The results don’t contradict the basic physics of crashes. Size and weight are still key, and a small, lightweight vehicle is going to fare worse than a big, heavy vehicle in a crash. In general, SUVs and pickups are heavier than cars, so in that sense different types of vehicles always will be mismatched. But the study shows that, beyond weight, differences in vehicle styles don’t have to be a safety problem.

— IIHS, Effort to make SUVs, pickups less deadly to car occupants in crashes is paying off, news release 9/28/2011

 Pickups remain problematic, though even they have shown improvement.

What if your Crash Partner is a Pedestrian?

None of the above addresses this topic. Other studies have shown SUVs/Light Trucks are significantly more dangerous to pedestrians compared with automobiles: “Analysis of these three databases has clearly demonstrated that pedestrians have a substantially greater likelihood of dying when struck by an LTV (light truck or van) than when struck by a car.”  The fatality and injury risk of light truck impacts with pedestrians in the United States, Devon E. Lefler, Hampton C. Gabler, Accident Analysis and Prevention, v.36, pp. 295-304, Elsevier (2004)  (see also an earlier paper/version from the same authors sounded the alarm  did anyone pay attention, or even care?  The Emerging threat of Light Truck Impacts with Pedestrians is basically the same article)

Similar study published in 2005 Injury Prevention: United States pedestrian fatality rates by vehicle type by L J Paulozzi of the CDC, using 2002 FARS data “Compared with cars, the RR (relative risk) of killing a pedestrian per vehicle mile was 1.45 (95% CI 1.37 to 1.55) for light trucks… The greatest impact on overall US pedestrian mortality will result from reducing the risk from the light truck category”. This methodology is very straightforward, it takes the FARS data and segregates it by bodystyle (the paper does not state exactly how that was done; it looks easy, see below); and computes the RR (relative risk) based on Table VM-1, which is in Section V of FHWA Highway Statistics 2002. UNFORTUNATELY, the fhwa stopped reporting VM-1 in that way. Commencing with 2007 they no longer differentiate between passenger cars and LTVs; inexplicably they now differentiate by wheelbase, thus that data is useless for this purpose; so i guess we’ll never know how many more pedestrians are killed by LTVs (SUVs, pickups, etc). There are some footnotes to VM-1, saying methodology changes due to motorcycle reporting that do not seem to explain this change.

However, the data is all available in any Traffic Safety Facts Annual Report, e.g. here is 2011 and 2012 (search the library for newer ones). It is in Tables 7, 8, 9, 10 for Passenger cars, Light trucks, heavy trucks, and motorcycles. It lists VMT, and registration data; the only thing left to do is to extract from FARS the quantity of non-occupant fatalities split by those 4 vehicle types. I’ve already added a “synthetic” field to my FARS mysql data called sMODEL, it is based on the FARS field MODEL.

Here is a newer meta-study, that i would guess references the Paulozzi study and has very similar result, that i need to look up from Traffic Inj Prev. 2010 Feb;11(1):48-56. doi: 10.1080/15389580903390623.Do light truck vehicles (LTV) impose greater risk of pedestrian injury than passenger cars? A meta-analysis and systematic review. ” the risk of fatal injury in pedestrian collisions with LTVs compared to conventional cars was odds ratio 1.54, 95 percent confidence interval 1.15-1.93″

(given the dramatic change in the mix of the US vehicle (higher percentage of light trucks) fleet since whenever the cross and fisher data came from (mid 70s)…. it would be interesting to know if anything could be shown more statistically in, say, 2005.

There’s something called the “household” fleet, see exhibit 1 of the NHTS (Nat. Household Trans Survey)… mixture changed from 80/20 (automobiles/light trucks) to 50/50(!) from 1977 to 2008

There’s also this from the Cross and Fisher data (mid 1970’s or so):

TYPE OF MOTOR VEHICLE DRIVEN BY MOTORISTS IN THE FATAL AND NON-FATAL SAMPLES

[…]

Table 12 shows that trucks are involved in a proportionately greater number of fatal accidents (19%) than non-fatal accidents (9.4%). More than 80% of the trucks were pickups or vans; the remainder were larger types of trucks. These data suggest that the likelihood of fatal injuries increases as a function of the size of the vehicle. For instance, dividing the proportion of fatal cases by the proportion of non-fatal cases yields a ratio of .9 for passenger cars, 1.9 for pickups and vans, and 3.2 for larger types of trucks. However, because of the small number of cases involving a truck, these data can only be considered suggestive.

Bad weekend in Scottsdale

Adot Incident 2609053 Update / FINAL on cyclist McCarty death: azcentral.com  The motorist who killed Shawn McCarty was fined a total of $420 (and the case is apparently closed). Regardless, It would appear that $420 is the “normal” fine schedule that anyone would pay. That would mean that the enhanced fine for 28-735 (section B) was exactly ZERO. How can that be? Would a judge or magistrate actually make that decision, or it is some sort of court “bug”? Continue reading “Bad weekend in Scottsdale”

One Arizona legislator REALLY doesn’t like photo red cameras

Our legislative elves have been hard at work trying to de-rail photo-enforcement. Again (click here for last year’s festivities). The biggest single item is supposedly dead as of March 6, 2012 — this would have referred a ballot measure which would prevent cities and towns from using photo-enforcement.

Safety studies have consistently shown a net safety benefit for photo-red enforcement. Net means that there are fewer serious injuries and fatalities. A few studies have shown an increase in the number of collisions accompanying the safety gains. See, e.g. the IIHS study, Red Light Running Kills, linked at trafficsafetycoalition.com. Or more locally, also see Scottsdale-based redmeansstop.org.

Here is a list of items in the current session (50th 2nd Regular. The Spring of 2012) of the Arizona Legislature, assembled by the Traffic Safety Coalition:

  • SB1315 – mandate personal service or certified mail for photo enforcement tickets
  • SB1316 – mandate that photo enforcement cameras cannot take pictures of red light running violations unless the light has been red for at least one second
  • SB1317 – mandate a study of intersections with red light cameras
  • SB1318 – force photo enforcement companies to obtain a PI License for each worker
  • SCR 1029 – put photo enforcement ban to the voters for approval

As noted above Senate Concurrent Resolution 1029 is for the time-being anyway dead… The first thing I noticed that was odd is that they are all in the senate. Upon closer inspection all four of the the senate bills have only one sponsor, and all four are the same guy; a Frank Antenori (R-30, Tucson). He clearly doesn’t like photo-enforcement, and is apparently making it his life’s work to defeat it’s effectiveness; if not ban it outright.

Aside from safety issues, the cameras can, and do, provide evidence that has been used to solve crimes; including (that I know of) catching a hit-and-run driver who seriously injured a cyclist in Tucson, a hit-and-run-driver who killed a cyclist in Tempe, and a assault-robbery-murderer in Tempe.

Stats?

Arizona has a particular problem with red-light running; despite improvement over the years, Arizona continues to be over-represented. For example in 2009 Arizona had 37 red light running (RLR) fatalities while New York had only 29…. Arizona being three times as dangerous as New York on a per capita basis.

The words below, written over 10 years ago continue to ring true today, from a 07/13/00 article in USA Today, Ariz. has deadliest red-light runners in USA:

Arizona has the nation’s deadliest red-light runners, with three of the country’s worst cities for fatal intersection crashes, according to a study of federal transportation data obtained by USA TODAY….  Arizona had by far the worst death rate among states, with 6.5 fatalities for every 100,000 people… Arizona also had three of the four most dangerous cities. for red-light fatalities. Phoenix topped all urban areas, followed by Memphis, Mesa and Tucson

In addition, cities with speed limits of 45 mph and higher on surface streets faced more serious red-light -running accidents… The Phoenix police officer says said that with an average of 330 days of sunshine a year, it’s typically usually perfect driving weather. That doesn’t mean motorists drive perfectly, however. Just the opposite. “If we got more rain or inclement weather, maybe it would slow people down some, particularly at the intersections,” Halstead said says. “As it is, they zip around the city at a pretty good clip.” And, according to the institute’s study, Phoenix drivers run red lights at an unrivaled pace. The city has by far the nation’s deadliest rate of fatal red- light running crashes, nearly five times the national average. Arizona and other fast-growing Western states have been particularly stung by red light crashes “because their wide open roads are suddenly seeing schools, businesses, and busy intersections crop up,” says said Phoenix traffic engineer Paul Wellstone. “The West has a reputation for being a drivers’ paradise; a place you can lay on the accelerator and not worry about the traffic and dangers. That’s changing now. Cities are struggling with getting their citizens to slow down.”

 The FHWA has a page on red light running.

Is Phoenix Safe?

[ Updated Sept 2018; this year’s Allsate 2018 America’s Best Drivers Report lists Phx rather low (less “safe” than average); not sure if anything has changed in methodology(?). ]

Sept 2015 Update: Each year we’re treated to this recurring tidbit of stupidity via Allstate Insurance press release which always gets picked up and published in the media: Arizona’s urban drivers score well for safety. ‘Well’ for safety?  Unfortunately Arizona remains significantly less-safe (i.e. more dead bodies) than average in US, and far worse than the best state.  Like as much as hundreds of percent worse, depending on which metric is chosen (VMT vs. per capita)
NHTSA state-by-state stats.


Phoenix was reputed to be America’s 7th safest city, according to this survey which looked at three factors relating to insurance. Clearly the stuff of newspaper-filler stories. Intrigued, I see that the survey involves ranking cities in three categories 1) Crime, 2) Natural disasters, and 3) Traffic safety; though it wasn’t clear how they were weighted. For example, traffic fatalities claim far more lives than murder, and the number of deaths in the U.S. due to natural disaster is miniscule.
That being as it may, their source for traffic safety rankings is the “Allstate America’s Best Drivers Report” (tm!), which Allstate claims “Reveals Safest Driving Cities”.

What it actually measures is the statistical likihood of having an auto insurance claim. Which Allstate claims, and I think sounds reasonable, as a proxy for the number of MV collisions. The next leap, which is demonstrably false, is that fewer collisions translates into “safety”. One glaring data point is enough to disprove this: cities of similar size are frequently and for good reasons ranked against one another; it just so happens that Phoenix and Philadelphia have virtually the same population, and are currently the 5th and 6th largest city in the U.S. Actual fatality data reveal that Phoenix is significantly more dangerous than Philadelphia, yet Allstate’s proxy data says just the opposite:

NHTSA Fatality Data Allstate data
City Killed population killed per 100K time between collisions rank (higher=worse)
Philadelphia 95 1547297 6.14 60.2% worse 6.2 years 187
Seattle, WA 30 616,627 4.87 25% worse 8.0 years 147
Phoenix AZ 159 1593659 9.98 1.1% better 10.1 years 74

Source: NHTSA Traffic Safety Facts 2009 (latest year available), Table 124 811402.pdf, and Allstate (follow link above; current year result they refer to as 2011, is similar to 2005-2010 ). Notes: overall U.S. fatals/population/ratePer100K = 33,808/307,007,000/11.01

So, Allstate’s data merely shows that Phoenicians suffer from fewer fender-benders than Philadelphians; but say nothing about safety.

Why is Phoenix so dangerous? The main reason is probably because it’s “Dangerous by design”, with a higher priority on moving more cars, at higher speeds; and a lower priority on getting everyone to their destinations without being killed. More driving could explain some but not all of the gap; this, in itself, a symptom of poor land-use choices.

I threw Seattle into the table simply because of this recent op-ed that aggravated me: why-seattle-is-safer-than-phoenix. Phoenix and Seattle are quite dissimilar in population, but here again the Allstate data claims Seattle is significantly more dangerous than Phoenix when just the opposite that’s true.

2014 Update

Here’s the figures based on Allstate released in Sept 2014. Phoenix is the “best” large city at 9.2 years; and coincidentally Philadelphia is the “worst” large city at 6.2 years.

Auto Insurance Center Fatality Statistics

An outfit called the Auto Insurance Center put out a statistical roundup that looked only at fatal crashes (covering data years 2005-2015) and then normalized each stat to each state by population, and then ranked the states. It’s a FARS data-mining exercise that comes up with sometimes curious stats of dubious value but interesting nonetheless, e.g. “Fatal car crashes caused by road rage were the most prevalent in Indiana (almost 13 fatalities per 100,000 residents)”. Variations like that tend to come from wide variations in reporting, not that there’s a lot more road rage in one state versus another.


By the way

I always have trouble finding this page at www-nrd.nhtsa.dot.gov (which can be found by searching for FARS, then clicking on “publications”) where it lists publications like Traffic Safety Facts; e.g. 2009 Traffic Safety Facts Data Summary Booklet ; and 2009 Traffic Safety Facts FARS/GES Annual Report, they list back to about earlier 1990’s.

NTSB calls for complete cell ban: LaHood backpedals

The NTSB has called for a complete ban on personal electronic communications device usage by drivers on the grounds that any non-emergency usage is unacceptable risky. Here is Deborah A. P. Hersman, NTSB chairman writing in USA Today on 12/15/2011:

Distraction, whether it’s hands-free or handheld, whether it’s texting or talking, is deadly. The National Highway Transportation Safety Administration (NHTSA) said distraction-affected crashes killed 3,092 people last year

Handheld-only bans, such as that proposed in the city of Tucson, are at best not likely to improve safety much; and in fact may have perverse effects. If handsfree become explictly permitted, it may well change behavior of those who formerly chose to abstain entirely, thus increasing risky behavior rather than reducing it.

Fast forward a couple of weeks, in late December “U.S. Transportation Secretary Ray LaHood said he won’t back a proposal to prohibit drivers from talking on cellphones, even hands-free devices, giving a boost to car makers and mobile-phone companies that stand to lose if regulators impose a ban” [wsj]. So there you have it, distracted-driver warrior LaHood won’t back a ban; along with an explanation of presumed pressure from business interests.

At this point, you might be wondering and confused about who-is-who in this Federal alphabet soup: What is the NTSB? This is a both interesting and intricate. One might think that NTSB resides under the DOT, however it turns out that is incorrect: “In 1974, Congress reestablished the NTSB as a completely separate entity, outside the DOT”.  The NTSB is run by a five member board; each nominated by the president for five year terms. Read that as far less politically sensitive, as compared to the Secretary of Transportation.

So Ray LaHood is Obama’s Secretary of Transportation; who runs the U.S. DOT, the United State’s Department of Transportation. And the NHTSA (National Highway Traffic Safety Administration) is the group, under DOT, tasked with highway safety.

There is an enjoyably-cycnical view of the subject at LaHood says hands free calls are A-okay; throws NTSB under the bus.

Recent DOT blog  fastlane.dot.gov touts enddd.org.

Listening to Phoenix’s Bicycle Collision Summary

[Updated Jan 2015: There are more recent summaries posted at  phoenix.gov/streets/safety-topicss; direct links (unfortunately, many of these links now are 404 or link to the wrong report): bike (2010) ; ped(2012) ; all traffic(2012); bike (2013) (see section below for 2013 numbers) also an interesting MV collision rate study spanning 2006-2010.  I did a quick glance at the bike and numbers are very similar to the 2007 which is detailed below… including the tendency of Phoenix PD to mis-characterize collisions at driveways and crosswalks as the fault of the bicyclist ]
[Update 2023: I see a bicycle summary for year 2020 , see below, which was released in 2022; ]

Phoenix, and many other entities issue a report, usually called something like a Bicyclist Collision Summary. For some background, complaints, and links to others, see Understanding Collision Summaries.

At hand, I have the most recent, 2007, report from the City of Phoenix, which can be still be found hereLocal copy in case that link breaks) Continue reading “Listening to Phoenix’s Bicycle Collision Summary”

Mesa traffic cameras to stay 2 more years

Story from AZ republic (via Tucson Citizen site; i don’t see it online otherwise. Also it ran in condensed form as an east valley brief 2/14/2012) Mesa traffic cameras to stay 2 more years.

Story mentions the Sean Casey fatality from 2005 where a junior high school student was killed while walking his bike through a crosswalk with a green light when he got whacked by a motorist who ran a red light. This whole story seems to have been a huge miscarriage of justice. A judge dismissed neg hom charges against the driver. And to add insult to injury, according to news reports the driver did not even pay her fine, or attend traffic school as ordered.

In any event the gist of the story is camera enforcement (among other factors) is credited with reducing crashes, according to Mesa Police commander Bill Peters: “Crashes at intersections now monitored by cameras dropped from 694 in 2005 to 370 in 2010, Peters said.”

Why Seattle is safer than Phoenix

An op-ed written by one of the wsj editorial board staffers illustrates a certain strain of belief in have-your-cake-and-eat-too-sism. Kaminski, in decrying how the mayor Mike McGinn (whom he gleefully points out is referred to as mayor McSchwinn by his political foes. Get it? it rhymes with McGinn) of Seattle worked to block the building of some car-based project; later claims that “Seattleites say they want to save the planet from global warming, but in their personal lives they want safe streets…”.

The disconnect Kaminski, and others of his ideological ilk, is this; that somehow streets can be made safer by ever-expanding the number and speed of privately operated motor vehicles. But this is simply not possible. Faster and more always equals more dead; mostly more motorists, but also more dead peds, and more dead bicyclists. The numbers are stark; comparing e.g. Phoenix with Seattle (metro areas), the Dangerous by Design survey estimates Phoenix to be FOUR TIMES more deadly to pedestrians than Seattle. The number spills over not just in pedestrian deaths, but also cyclists deaths, and also to MOTORISTS deaths; see e.g. Beyond Safety in Numbers: why bike friendly cities are safer (for everybody).

Thus Kaminski rejects car-user-fees as hair-brained; yet motorists are the source of enormous externalities — economic impacts that aren’t paid for by their users — from air pollution (never mind ‘global warming’), to mayhem, to free parking.

By the way, McGinn has only been mayor for the past two years; I’m not suggesting that McGinn has made it safer. It was already safe, relatively speaking — due in no small part to its general overall “anti-car” culture.

Addendum

Seattle DOT (SDOT) puts out a fancy traffic safety report (every year, i imagine), e.g. here is  2011. Note the “speed studies”, p 7-7… their major streets are posted speed limits of mostly 35, with a few at 30, and one at 45. The 85th percentile speeds were running in the high 30’s.


FARS and PBcat

Commencing with the recently-released 2010 data FARS (The USDOT’s Fatality Analysis and Reporting System) will have far more specialized detail on Pedestrian and Bicyclists crashes.

“Motorist Failure to Yield — signed intersection” One of several dozen crash types defined by PBCAT

618 cyclists (person type 6 bicyclist, and 7 other pedalcyclist) were killed in 2010 in traffic collisions — and as noted at the link above, only collisions with motor vehicles in-transport are tracked by FARS. So for example, a bicyclist who lost control and died as a result of crashing into a tree would not be tracked here, nor would a bicyclist who strikes a parked motor vehicle. Continue reading “FARS and PBcat”

Camelback Road Diet and Buffered Bike Lane

Here are some city documents:

The Diet

The diet part of the plan seems like a slam dunk… Normally any road diet is opposed becasue of fears that the lane removal will increase automobile congestion. In this particular case, that isn’t possible because of the unusual circumatance that this 1-mile stretch of 3 through lanes in each direction, is bounded on both ends by 2 through lanes. I.e. both north of Bethany Home Road, and south of Camelback Road is already only two lanes.

The Buffered Bike Lane

The “problem” then became what to do with “extra” space? A generously wide bike lane, including gutter is only 6′ wide, and the diet meant that 12′ of space had to be filled (in both directions). The answer came in the form of placing a 6′ buffer between the bike lane and the rightmost traffic lane. A.k.a a Buffered Bike Lane, see e.g. nacto.org.

I am somewhat skeptical of placing space between cyclists and overtaking vehicles. While this is presented as an un-alloyed good thing by many facilities advocates, it clearly has safety drawbacks which usually go unmentioned. here is a more balanced view, as presented in the Feb 2010 (the latest) Draft AASHTO Guide, p.78 (my emphasis):

Striped buffers may be used to provide increased separation between a bike lane and another adjacent lane that may present conflicts, such as a parking lane with high‐turnover or a higher speed travel lane. The benefits of additional lateral separation should be weighed against the disadvantages; a buffer between the bike lane and the adjacent motor vehicle travel lanes places cyclists further from the normal sight lines of motorists, who are primarily looking for vehicles in the normal travel lanes, and buffers between the travel lane and bike lane reduce the natural “sweeping” effect of passing motor vehicles, potentially requiring more frequent maintenance.

 That all being said, I objected to the original design which called for the outer buffer stripe to gradually arc into the intersection. This seemed to me to be a recipe for extra right-hooks. City staff readily agreed to my and Gene’s suggestion to end the buffer ahead of each intersection, and then a bit of dashed line; which is incidentally, as shown in the NACTO guide as recommended. (so thanks to Kerry Wilcoxon, and Joe Perez).

This should make the buffer “not bad” at intersections, yet doesn’t do anything for the many driveways. In other words, it should be no worse than a standard bike lane at intersections, but I fear it will raise risks at driveways relative to bike lane. So anyway, I’m reserving my judgement on the whole buffered bike lane thing. The hope is that it will encourage/entice cyclists off the sidewalks, where most collisions occur. However that doesn’t help those of us who are already legally using the roadway, and in fact may well be putting us in more danger.

The re-striping

The striping project apparently happened on schedule 4AM Saturday morning 1/7/2012, there are some pics on P4’s Facebook page (f.b. login required to view). TBAG has listed a ride to visit the new work on 1/8/2010.


Is Bicycling Safe? Is Bicycling Dangerous?

Short answer: As with all modes of transportation, it entails some danger.

Longer answer: yes, similar to the risk of motoring — perhaps twice as risky. but how to measure? (per mile, per trip?). Bike-MV collisions are currently running 2% of all in AZ. Bicycling represents perhaps 1%, i.e. twice the risk.

For the moment, this is going to be a catch-all for links and related info on the topic. Links:

Continue reading “Is Bicycling Safe? Is Bicycling Dangerous?”