Loop wall down, loop wall down!

12/29/2011: A wrapped (i couldn’t quite read what it said?) pickup pulling a trailer apparently lost control and (of course) drove over the sidewalk and knocked down a wall on the Warner-Elliot loop near Nambe Street. Here is the ahwatukee.com story; following their pattern, police didn’t identify the driver saying only he was a man in this 60s.

This is less than a mile away from the site where a driver lost control and iced a jogger, Rene Karlin, on the sidewalk back in August. Whatever happened to that investigation of the un-named driver? Why is the driver un-named? Nobody bothers to report. Nor did police bother to release the name of the elderly driver who drove into Lakewood’s fountain last year.

For some more wall knockings down see here, very popular pass-time.

In other news, I usually consider residential streets pretty calm and serene, and they usually are — then there was this parked car that got whacked on Desert Broom Way just two-door away from my house on (i guess the early morning hours of) 12/28/2011… It got hit really hard, though it’s not apparent from this pic, besides the obvious side-swipe damage, the rear wheel was pushed way ahead and the tire flattened; this car is going to need a LOT of work to get it right.

And while I’m on the subject, here’s a pic of a car I discovered abandoned a couple of weeks ago that had run off of Ray Road, crossed the sidewalk, and landed in the bushes. It must have been going pretty fast becasue jumping the curb flattened all of its tires. Sheesh. I imagine it was stolen.


Newer Wall-down story from early 2013

This was on Kachina in Ahwatukee/Phoenix. Their neighborhood is hoping to get speed bumps added as of early March, see slowdownonkachina.org
KPHO5 story: Feb 25, 2013 Teens crash into block wall in Ahwatukee; Police are investigating after three high schoolers who allegedly spent the morning drinking off campus plowed a car through a block wall in an Ahwatukee neighborhood… Wagner told us the driver was arrested at the scene for DUI but none of the teens were hurt.

Story in the Scottsdale Times about 3-foot law

This is a freebie paper published under various names: The Scottsdale Times, The Ahwatukee Times, etc…

I was generally not terribly unhappy (see my general complaints about media bias ) with how it turned out. I was pleased that the reporter, Christina Fuoco-Karasinski, was willing to spend some time researching information I sent her prior to a phone interview, which itself lasted perhaps 15 minutes. The parts I spoke with the reporter about came out pretty well:

According to the Arizona Department of Transportation, there were 1,914 accidents in Arizona last year involving automobiles and bicycles. A total of 25 bicyclists were killed by motorists in 2009, and 19 were killed in 2010. For comparison, a total of 762 motorists were killed [*] on Arizona roads during 2010, a fact Ed Beighe, of azbikelaw.org, a bicyclist activist website, says should be noted. “So while we’d all like to see bicycling be safer, bicycling represents a small part of an overall large problem,” Beighe says.

The number of injuries to bicyclists number in the thousands, however. There were 1,648 reported injuries to bicyclists in 2009 and another 1,583 in 2010.

“Most bicyclist-motor vehicle collisions occur when one or the other is making a turn movement [this probably would have been better stated as “turning and crossing” movements] — and not overtaking,” says Beighe, who stresses that he is not a lawyer. “But the relatively few overtaking collisions (bicycle struck from behind by a passing motorist) that do occur tend to be more serious than average.”

He says the 3-foot passing law is helpful in raising awareness among motorists. It shows drivers what to expect when overtaking and what they should see. However, Beighe says, the law itself is difficult to enforce and, in fact, “very, very few” citations have been issued outside of a collision, where it is often irrefutable that the motorist encroached upon the 3-foot right-of-way.

In many cases, when a bicyclist is struck and either injured or killed, no citation is issued for not allowing for three feet of clearance, says Sterling Baer, co-founder of Not One More Cyclist and himself an avid cyclist. The reason is that the cause of the accident often becomes a criminal act rendering the 3-foot citation irrelevant, as it takes a backseat to more serious felony charges.

“It actually hides or sort of skews the real statistics that show many of these kinds of events are happening,” Baer says.

berth rights: State law affords bicyclists a 3-foot right of way. Just try telling them it’s unsafe.


* The 762 figure is mis-stated. There were a total of 762 persons killed in fatal traffic collisions. Since 19 pedalcyclists and 155 pedestrians were included within that total, that leaves 588 motorists killed. See adot-2010-crash-facts for references.

How Risky is it, Really?

There’s a wonderful book written by author and former journalist David Ropeik that explains risk perception (and MIS-perception) in elemental terms; How Risky is it, Really?.

His explanations go all the way down to the biological and evolutionary level — think adrenalin, amygdala, and the fight/flight response — and it’s all very fascinating. Everyone should read it.

More to the point here, his “confessions” as a former journalist i think go a long way to explain the persistent problems with media stories regarding risk (p. 165):

Before I go on, mea culpa. I was a daily television reporter for 25 years, and most of the things that journalist do that make the world sound like a riskier place than it is, I did…. I regularly played up the dramatic aspects of my stories, emphasizing the negative or the frightening or the controversial, and deemphasizing (or omitting altogether) the aspects that would balance things out of put them in perspective… I never lied… But I did what most journalists do: I made choice that would make my stories more newsworthy, more dramatic , and more likely to attract attention. And that left my views with a distorted and more alarmning view of the world than was actually the case.

Framing

In chapter 2, Bounded Rationality, he explains several shortcuts we (everyone) use to determine whether something is safe vs. risky. Among them is how any particular issue is “framed”; this is critical in any sort of news story. Consider the following two statements:

Statement 1; actual quote from an AZ Rep news story on the BSAP:

Last year, 19 bicyclists died and more than 1,500 were injured, according to new Arizona Department of Transportation statistics

Statement 2; re-framed in terms of overall traffic safety

During the study period,  bicyclists accounted for only 1.5% of all traffic collisions, and less than 3% of traffic fatalities, according to Arizona Department of Transportation statistics. This indicates that bicycling is a small part of a very large problem

Which sounds scarier to bicyclists? Which reinforces notions of danger? Is 1,500 injuries (or 19 fatalities) a lot, or a little?

The thirteen Risk Perception Factors

  1. Trust
  2. Risk vs. Benefit
  3. Control
  4. Choice
  5. Is the risk natural or human-made
  6. Pain and suffering
  7. Uncertainty
  8. Catastropihc or chronic
  9. Can it happen to me?
  10. Is the risk new or familiar?
  11. Risks to children
  12. Personification
  13. Fairness

These factors fuel what Ropeik terms the Risk-perception Gap; which leads to poor decisions being made both by individuals and by society.

Free Range Kids

Along the same idea, is so-and-so’s book Free Range Kids, which I am now reading (Jan 2012)

Final 2010 U.S. Motor Vehicle Traffic Fatalities released

Final 2010 figures

…released 12/8/2011;  fastlane.dot.gov, at 32,885 the number is slightly higher than the early estimates which come out in the spring.

The 2010 dataset is not yet available in FARS, which is a little strange given that last year’s data was released in September (i.e. 2009 dataset available September 2010). update: the 2010 FARS data came up sometime in early December.

Final Arizona 2010 figures were released in August.

NHTSA’s Traffic Safety Facts 2010 Motor Vehicle Crashes: Overview, DOT HS 811 552

Bicyclist Fatalities

As bikinginla.wordpress.com  points out, 618 cyclist deaths in 2010 makes it the lowest overall figure in some 35 years. The Arizona figure, 19, puts it close to our 10-year average; coming off of a bad 2009 (25).

Ped Problems?

USA Today article: “The USA is getting riskier for people on foot, and experts aren’t sure why.” Mike Sanders noted the ped issue, see comment here on the final Arizona 2010 figures.   Speed matters and need to redefine mobility – “Everyone should be familiar with the chart that shows that a pedestrian hit by a car traveling at 20 miles per hour (mph) has an 85 percent survivability rate. That same collision with a car going twice as fast, 40 mph, will lower the survivability likelihood to 15 percent” (Laplante and McCann, Complete Streets: We Can Get There from Here, ITE journal, May 2008).

An rather than viewing it as a zero-sum game where motorists must lose mobility in order to make streets safer for peds; Beyond Safety in Numbers suggests that the safer streets for peds are quite likely safer streets for motorists as well.

Early Estimate of Motor Vehicle Traffic Fatalities in 2010

The early estimates come out in the spring (late march i think), here was the buzz at that time…

The media is abuzz with projections released a couple of days ago by NHTSA that 2010 traffic fatalities are at there lowest number since the Truman administration, and the closely-watch per VMT figure is the lowest ever recorded. Early Estimate of Motor Vehicle Traffic Fatalities in 2010:

A statistical projection of traffic fatalities in 2010 shows that an estimated 32,788 people died in motor vehicle traffic crashes. This represents a decline of about 3 percent as compared to the 33,808 fatalities that occurred in 2009…  The fatality rate for 2010 are projected to decline to the lowest on record, to 1.09 fatalities per 100 million VMT, down from 1.13 fatalities per 100 million VMT in 2009

Here are the Early Estimates for 2009, and 2008. Continue reading “Final 2010 U.S. Motor Vehicle Traffic Fatalities released”

Elite athlete killed in Maricopa collision

On 3/8/2011 mid-afternoon; Elite athlete Sally Meyerhoff was killed in a collision in (the town of) Maricopa, at the intersection of Maricopa-Casa Grande Highway and White and Parker Road (“White and Parker” is one road). The intersection is not anywhere near 90 degrees; as can be seen in the google maps. Continue reading “Elite athlete killed in Maricopa collision”

Arizona has the highest cycling fatality rate?

[updated October 2010: Final data for 2009 has AZ as 4th highest bicycling fatality rate (per capita, i.e. per population). See e.g. this media story referring to the BSAP]

Tied to April being bike month in Arizona is of course a crop of media stories.

Imagine how surprised I was to read that “Arizona has the highest cycling fatality rate, based on population in the United States”. Continue reading “Arizona has the highest cycling fatality rate?”

Motorcyclist killed by driver making a bad left

Off duty Tempe police officer Scott Saffell died in a motorcycle-car wreck at an Ahwatukee intersection. The motorcyclist was proceeding straight through southbound 48th Street, when the unnamed driver made a bad left just north of Elliot Road. The “enhanced” criminal traffic charge would be 28-672. Continue reading “Motorcyclist killed by driver making a bad left”

Another Ray Road Wreck in Ahwatukee

Westbound, single-vehicle, presumably one or more fatalities occurred Sept 24, 2011 early morning hours. The vehicle was apparently going way too fast, lost control and smashed into some trees in the median. I didn’t see any skids. The palm tree got decapitated, and a smaller tree was snapped off (you can see the original trees in the google maps streetview, below). The picture barely shows the twisted wreckage. The cops were keeping people way way way away. To the extent one wonders what was trying to be hidden? I was told I “can’t” take a picture. Weird. Continue reading “Another Ray Road Wreck in Ahwatukee”

Driver who killed Tucson bicyclist given 33 years

Historical incident. Backdated.

9/4/2011  ~ 900am. victim: Albert Eugene Brack was killed riding his bicycle east on Escalante Road near the intersection of S Calexico Avenue, Tucson.

Some other info on bicycletucson.com Continue reading “Driver who killed Tucson bicyclist given 33 years”

ADOT’s Bicycle Safety Action Plan Study

ADOT’s Bicycle Safety Action Plan Study ( the study’s home-page link is now dead ) is a multi-phase plan to assess and improve bicycle traffic safety, with emphasis on Arizona state highways. In urban areas that often means the interchanges. Here are direct download links to final reports:

During the five-year study period “There were a total of 9,867 bicycle crashes statewide in Arizona…  crashes that occurred on state highways were extracted from the statewide data set. There were 1,089 bicycle-motor vehicle crashes reported on state highways between January 1, 2004 and December 31, 2008” from this a focus area was determined, within the focus area there were 746 bicycle crashes.  PBCat was used to crash-type all 746 of these collisions.

Thus this data set accounts for a small minority of bike-MV crashes, around 11%. But Working Paper 1,  table 15 offers a useful comparison between the studied data and all statewide data. For example, we see the same suspiciously-high percentage (24 to 25%) of “other” fault ascribed to bicyclists as with other studies. As I’ve written before, the “other” fault is generally the result of a poor/improper crash investigations that tends to wrongly faults cyclists who are doing nothing illegal (see Understanding Collision Summaries) — this is statistical proof of poor-quality investigations are a statewide problem for bicyclists. This is a shortcoming of the crash reports, and not the BSAP;  in Working Paper 1, figure 20, something they call “primary contributing factor” by crash group is assigned overwhelmingly to motorists (67%), and only 24% to bicyclists.

Press coverage

There was a lengthy, front page A1,  Arizona Republic article by Sean Holstege on Sept 17, 2011 which perhaps was intended to be about the plan but did wander, understandably, to general topics. For example they make great hay out of the per capital fatality stats, without any discussion of how to interpret them — e.g. how weather probably affects them, with Arizona being more of a year-round cycling state; or a higher per capita usage, e.g. Arizona has significantly higher (than US) percentage of commuters (according to census figures, see Working Paper 1, Table 1 — Arizona is 0.9% versus 0.5% nationwide).

The story, as many “bicycle safety” stories do, lacks context of traffic in general. So, for example, there was a chart of the number of bike-MV collisions (about 2,000/year total). There is no mention of the fact that that represents only a tiny fraction of all MV collisions ( which ran well over 100,000/year over the study period). And though it mentions the number of fatalites, say 25 in 2008 — it never mentioned the total number of traffic fatalities (it runs around, and lately something under, 1,000 per year).

So here are some hard numbers, over the five year period 2004 – 2008 there were 681,466 MV crashes, of which 9,730 were bike-MV — a little less than 1.5% (taken from the historical overview in the 2009 Bicyclist Fatality study, which were gleaned from AZ Crash Facts — note that the numbers a slightly different in the BSAP, but I don’t know why). The number of fatalities is 4,943 total, 132 bicyclist; or 2.67% — so bicyclist fatalities were somewhat over-represented but not dramatically so.

Note that the ADOT plan by design is aimed at the small percentage of bike-MV crashes that occur on the state highway system. “The majority of bicycle crashes in Arizona (approximately 90 percent) occur on local, city, and county roadways outside of ADOT jurisdiction”

Also, by the way, the article inaccurately stated that the BSAP recommends a mandatory taillight law. That was in an earlier draft but was since removed — I don’t believe there is adequate evidence to support the additional burden on cyclists. The article does correctly mention that the BSAP recommends state-level sidewalk law clarifications, which seem like a worthy endeavor, given the huge proportion of sidewalk-related collisions, along with the current legal murky morass that currently exists when cyclists who cycle on the sidewalk subsequently collide with vehicles in crosswalks and driveways.

Statistics

The raw data from the 746 crashes studied can be viewed and mapped at this google fusion table.  I also read the data into a mysql database, bsap, password access available upon request using a scheme analogous to asdm and presently only available on mysql.azbikelaw.org, and not on the godaddy server.

The crashes studied were full-blown pbcat 2.0 with crash types, groups, cyclist’s direction; that’s the good news. The bad news is it’s not clear how that relates to bicyclist crashes in general.

Fatal vs. non-fatal: The dataset mentioned above, the 746 crashes includes only 4 fatalities and is data only from the focus area. The BSAP report has several charts and graphs that refer to 24 fatalities. The distinction is that the total 24 is over the entire SHS (state highway system); whereas the 4 is only the focus area. I don’t have the raw pbcat data for the 24 (or rather , the other 20).

BSAP-esqe Data

Here is a bunch of data extracted via query from ASDM data  — currently covering years 2009-2014. In other words, it is an attempt to automate the types of data presented in the BSAP but applied to all Arizona bike-MV crashes, not just state highway system.


Summary of PBCAT results

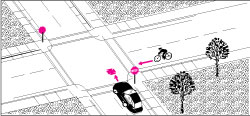
Many of the motorist drive out’s (from stop signs, or performing a right-turn on red) involve counter-flow sidewalk cyclists. Out of the 746 crashes studied here are the top 5:

Table 5 – Top 5 Crash Types 
Percentage of SHS Focus Area Crashes Crash Type Description 
103 13.8% Bicyclist Ride Through ‐ Signalized Intersection
 83 11.1% Motorist Drive Out ‐ Sign‐Controlled Intersection
 76 10.1% Motorist Drive Out ‐ Right‐Turn‐on‐Red
 71 9.51% Motorist Drive Out ‐ Commercial Driveway / Alley
 61 8.17% Motorist Drive Out ‐ Signalized Intersection
746       Total SHS Motor Vehicle‐Bicycle Crashes

Also interesting title of this PBIC presentation How to Create a Bicycle Safety Action Plan: Planning for Safety. It’s from the toole design people so, as expected, is filled with nacto and facilities stuff.

ADOT 2010 Crash Facts

ADOT’s 2010 Motor Vehicle Crash Facts has just been released.

Highlights are the total number of fatalities continued to fall; there were a total of 762 persons killed in 2010, a 5% decrease from the year before.

There were 19 bicyclists killed on Arizona’s road in collisions with motor vehicles in 2010, which compares favorably with the 25 killed in 2009. That means there are two (possibly three) missing from this tally for 2010.

The MOST COMMON DRIVER VIOLATION is (remains) Speed too fast for condition

There were 106,177 crashes in total, of which 1,914 were bike-MV crashes.

Dangerous by Design

[updated regularly; the one release in May 2014 can be found at smartgrowthamerica.org I don’t think anything much has changed Phoenix and Arizona still rank “high” (bad) ][direct download of 2016 edition]

While we’re on the subject, t4america.org released the latest version of their recurring report Dangerous By Design 2011; where metro-Phoenix has a recurring, starring role as a particularly dangerous place for pedestrians — the 8th worst rate in the US. The only places significantly higher are basically several (!) metro areas in Florida.

Bad for pedestrians tends to translate into bad for motorists and bicyclists, as well — in other words, we’re all in this together.  Arizona’s motorist fatality “VMT rate  is over twice as deadly as Massachusett’s. The disparity in per capita rate, since Arizonans drive more miles, is even worse…. more

But you are not likely to hear anything about how or if or why Arizona isn’t closing the gap; or even that a gap exists! — rather that deaths overall have merely fallen. Here is a typical new-release-style story: azfamily.com story

Back to the DbyD report, they have this concept called PDI, the Pedestrian Danger Index; Phoenix-metro at 132 is many times worse than, for example, Boston-metro at 21.6.

And just to throw out a factoid, for the year 2009 (the most recent year for which detailed stats are available) there were more bicyclists killed within the City of Phoenix (9) than were killed in the entire state of Massachusetts(6).

The population of Phoenix is 1.5M versus State of Massachusetts having 6.5M…. The C.O.P., accused rightly as being an enormous-sprawling place covers 516 square miles, the state of Massachusetts 7,840 square miles of land area.

John Allen’s blog reflecting upon the fact that in the DbyD report, the Boston-metro area came in dead last (SAFEST!) of all large metro areas in US — “Strange, isn’t it — the Boston area has repeatedly been derogated as supposedly having the nation’s craziest drivers”.

Arizona’s Rural Highway Traffic Safety Problem

A couple of days after the data was released, and somewhat to my chagrin, the arizonarepublic/news/articles/2011/09/02/20110902arizona-deadly-rural-roads.html did a fairly long and detailed piece on what ADOT is doing to identify and address rural highway problems… though, interestingly, the latest Crash Facts shows a steeper decline in rural as opposed to urban fatalities.

So far, no one that I know of, has said or suggested that Arizona’s high rate of rural fatalities is what accounts for Arizona’s overall high traffic fatality rate. Perhaps that is so?

As mentioned in the article, rural fatal crashes tend to be single-vehicle — though that is a little misleading because a bike-MV, or ped-MV crash is defined as a single-vehicle.

Here are the number of fatal crashes split by urban/rural for 2009 and 2010:

Peds fatal crashes, total/urban/rural: 156 / 102 / 54 ( 2009: 121 / 77 / 44)

cyclists killed, total/urban/rural:         19 / 17/ 2 ( 2009: 25 / 17 / 8 )

(all inclusive) Number of fatal crashes, total / urban / rural: 698 / 354 / 344 (2009: 709 / 299/ 410)

Here is some discussion of the 2010 National results: early-estimate-of-motor-vehicle-traffic-fatalities%C2%A0in%C2%A02010/

Woman dies after being hit by car on Ahwatukee sidewalk

file this under Are Cars Dangerous? and Seriously, how often does this happen? .

A jogger, later identified as 56 year-old Rene Karlin, was killed while jogging on the sidewalk near my home in Ahwatukee (city of Phoenix). Continue reading “Woman dies after being hit by car on Ahwatukee sidewalk”

Where to ride on the road

Assembled below for quick reference is a compendium of the consensus view of all traffic safety subject-matter experts about where to ride — this generally applies when riding straight ahead, and between intersections or other conflict zones. For why this is not only safest, but legal, see take-the-lane.

What the Experts Say…

Arizona Dept of Transportation

Arizona Bicycling Street Smarts is a short book based on bicycling traffic expert John Allen’s Bicycling Street Smarts; augmented with references to specific Arizona statutes, and published by the State of Arizona Department of Transportation (ADOT). The full title is Arizona Bicycling Street Smarts: Riding Confidently, Legally and Safely, and is available online in its entirety. Continue reading “Where to ride on the road”

Beyond Safety in Numbers: Why Bike Friendly Cities are Safer

I don’t have time to figure any of this out, but in a nutshell, this sounds like a reasonable explanation;

The traffic fatality rates tend to be tied together (i.e. car vs. bike vs. ped), and…

high death rate places have faster traffic in general and vice versa.

Beyond Safety in Numbers: Why Bike Friendly Cities are Safer. The full published paper is linked, but i haven’t looked at it yet. (and i can’t open it on my android tablet?)

Why is AZ so deadly; and why does no one seem to notice or care?

Does, or could this explain the huge disparity between, for example, Arizona’s high traffic fatality rate and Massachusett’s extraordinarily low fatality rate? Check out the NHTSHA numbers here. Arizona’s rates are between TWO AND THREE TIMES as deadly as MA. Why?

These are composite traffic fatality rates, not bicyclist or ped or motorcyclist.

Safety In Numbers

More about Safety In Number on azbikelaw.org; or this is an excellent backgrounder on aseasyasridingabike.

Safety in numbers: more walkers and bicyclists, safer walking and bicycling P L Jacobsen 2003
Inj Prev 2003;9:205-209 doi:10.1136/ip.9.3.205

Moto-bicyclist killed in Tempe hit-and-run

In an update to this July 2010 story, as the City of Tempe prepares to turn off its photo-enforcement effective July 19, 2011, police mention that those very photos were instrumental in capturing the suspect, Cody Davis, who fled the scene. See Police: Photo enforcement’s impact goes well beyond traffic infractions from the EVtrib.

UPDATE: Police arrest suspect 7/17/2010 [abc15] “Tempe police say Cody Ryan Davis has been charged with leaving the scene of a fatal accident in the death of Bradley Jason Scott, 32, Continue reading “Moto-bicyclist killed in Tempe hit-and-run”