the minimum bike lane width is 5 ft (1.5 m), measured from the face of a curb or vertical surface to the center of the bike lane line
However, that changes when a gutter pan is involved, more width is required to meet their recommendations —
Along sections of roadway with curb and gutter, a usable width of 4 ft (1.2 m) measured from the longitudinal joint to the center of the bike lane line is recommended
In mid December 2016 Sfbike.org (SanFrancisco Bike Coaltion) issued a warning regarding how Uber autonomously driving cars make right turns. At nearly the same time Uber has de-camped from CA (see e.g. this 12/22/2016 article from recode), literally loading their fleet onto car carriers and driving them to…. Arizona! The decision was based on CA’s regulatory environment for autonomously-driven cars; Uber decided they didn’t want to pursue special permitting which the CA DMV said was required, whereas Arizona has no special permitting required — so long as there’s a live driver sitting in the driver’s seat. More about Uber, below. Continue reading “How to make a right turn”
The City of Tempe installed a bike box on the east side of 10th Street at Mill Ave. Note that in that google street view, there is already a bike box on the west side of the same intersection, installed by ASU according to the news item (apparently ASU and not the City of Tempe has jurisdiction over that piece of 10th street?). Continue reading “City of Tempe tests ‘Bike Box’”
When the final portion of the Loop 202 / South Mountain Freeway (SMF), the part that connects I-10 to Laveen, gets constructed it will replace Pecos Road. Pecos Road in Ahwatukee will be no more. This would otherwise leave everything west of 19th Avenue inaccessible from the rest of Ahwautkee, except for the freeway. The construction of SMF is supposed to begin summer 2016 and opens late 2019. Continue reading “Chandler Boulevard Extension”
For background on the SLM (Shared Lane Markings, a.k.a. sharrows) on the phoenix-side, see here, and more pictures here. That first link has an explanation as to why this bridge is an important and useful link for bicyclists. Continue reading “Guadalupe and I-10 Bridge”
1/24/2016 11:45am Tucson-area (Pima County Sheriff’s dept investigates).
A (somewhat elderly, coincidentally) female bicyclist traveling west on Sunrise Drive was killed by a very elderly motorist who was merging from Skyline Drive and apparently failed to yield. The bicyclists was later identified as 69 y.o. Patricia Lyon-Surrey. Continue reading “Bicyclist killed in crash on Tucson’s northside”
Chandler Blvd is vastly wide, and lacks bike lanes west of ~ 54th St.
This is pretty interesting for those of us in the Ahwatukee / Chandler area…
[ update: 11/2017 here is the “15%” Initial Project Assessment ; also see below for related update on Phoenix side circa 2020 ]
[Updates, as of early 2022; project is completed, scroll down]
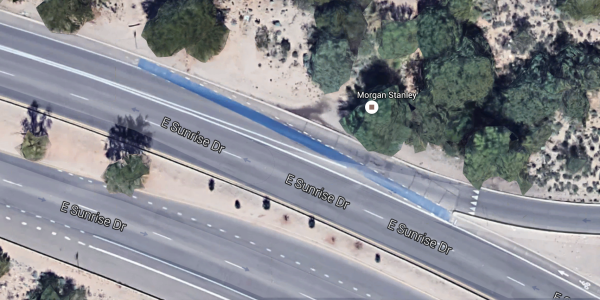
City of Chandler has made a request for TA/CMAQ (see also alameda-drive-tempe-bicycle-pedestrian-proposal for more about TA/CMAQ) funding to add BLs on Chandler blvd between where they stop now (~ 54th St) and continue them to the “far” side of the bridge (City of Phoenix jurisdiction). It’s about .4 miles and the bottom line cost estimate is ~ 600,000 (details are in the link below). The main money driver here is some of the area needs to have curb/gutter/sidewalk relocated in order to make room. See the area on Google Maps. Continue reading “Funding proposal would add BLs on Chandler Blvd over I-10”
Attention bicyclist advocates: resist the urge to desire dedicated bicycling facilities when they won’t fit safely.
In the accurately scaled example diagram below (visit iamtraffic.org to tweak the dimensions and vehicle choices. A very cool tool!) a cyclist riding an upright bike is riding centered in a 5′ BL w/curb abreast of a Ford F-150 driving centered in the right general purpose travel lane (and DON’T say “car lane”, or somesuch).
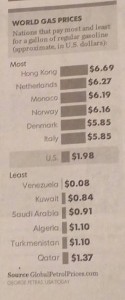
News item, Feb 2016 — Gasoline costs TRIPLE in the Netherlands, and Denmark compared to USA
My notations from the book: City Cycling edited by John Pucher and Ralph Buehler.
John Pucher is arguably the foremost American proponent of separate bicycling infrastructure; often called “Dutch-style”. He is an academic (planner-type; he’s not a traffic engineer) who has many published articles on the subject. And while he is a vociferous advocate for infra, if you read his work fully, he does at least mention there are other factors at play; and furthermore he considers these other factors as necessary to achieve high levels of safety and mode share a la Netherlands or Copenhagen. Among those other factors are, for example, the extremely high costs associated with motoring in those places with high bicycling mode share (duh). In the book, he covers these in the chapter Promoting Cycling for Daily Travel (see below). Here’s a brief excerpt where Pucher explains:
In short, such pro-bike ‘carrot’ policies [e.g. cycle tracks, bike parking] are indeed possible even in a car oriented country like the USA. By comparison, there is almost no political support in the USA for adopting and implementing the sorts of car-restrictive ‘stick’ policies listed in Table 3 [e.g. expensive fuel, high taxes, expensive vehicle parking, restrictive land-use policies] that indirectly encourage cycling in the Netherlands, Denmark and Germany.
He also shows trends for a bunch of countries in fig 2.7 — it would be worth it to put that into Evan’s perspective of looking at the broader traffic safety picture internationally: Traffic fatality reductions: United States compared with 25 other countries in which Evans shows how badly the US is lagging in overall traffic safety compared to virtually the entire rest of the developed world. Continue reading “City Cycling”
This article is to document the problems with the designated bike lane on Warner Road specifically at the intersection with Kyrene in the City of Tempe. Remember, there’s literally no excuse for bad bike lanes; if you can’t build them properly, then don’t build them. Continue reading “Warner and Kyrene”
[this will be a catch-all for issues relating to legal requirement to use bike lanes (BLs). This was moved from the article explaining When must I ride my bicycle on the shoulder?, because it was muddying that issue unnecessarily; after all BLs are not shoulders and shoulders are not BLs. For all the details about shoulders, see that article; the short answer is their use is almost never required, that conclusion stems from the fact that shoulders are not part of the roadway.] Continue reading “Arizona does NOT have a mandatory Bike Lane Law”
Below for illustration is 4 different lane treatments commonly used on urban arterial roads — these all just so happen to be the same road, Chandler Blvd, in the City of Phoenix: Continue reading “One Road, 4 Treatments”
There is no excuse for improperly engineered bike infrastructure. It takes on two forms, 1) simple straight-up wrong, and 2) “fake” facilities, those which masquerade as something they’re not; they’re in reality nothing more than shoulders, yet they are intentionally tarted-up to appear to be, and even be referred to as bike lanes (see e.g. Flagstaff, below). Continue reading “No Excuse”
A standard sign with placard, “legalizes” thru-bike usage.
it is a common occurrence — familiar to every bicyclist — where you can be riding along a perfectly nice bike lane only to have it disappear for various reasons.
Bike lanes are highly prized for making cycling “more comfortable”; so I think it’s safe to say disappearing bike lanes would be considered quite stressful, and an impediment to cycling for many cyclists.
Disappearing Bike Lane; Warner Rd at Hardy Dr, Tempe, AZ
I have, over the past year, had occasion to regularly ride along Warner Road in Tempe (this area is sometimes referred to as “south” Tempe. Here’s a map of the general vicinity) between I-10 (the city limit) and McClintock Drive; it’s about 3.5 miles. The road is very much an arterial road with two fast through lanes (45mph, if i recall correctly) plus a bike lane each way plus some sort of middle lane throughout (it’s usually a TWLTL; two way left turn lane; it becomes a left turn lane at major intersections). The difficulty is at every intersection where there is a right turn only lane, the bike lane is dropped ~ 250′ from the intersection. This dropping occurs asymmetrically at some, but not all, of the major intersections. It is most prominent westbound: the lane drops at McClintock, Rural, Kyrene, Hardy, and Priest Drive. That is FIVE TIMES in three miles! Continue reading “Should Warner Road bike lane have a “Combined” Turn Lane?”


 The City of Tempe installed a bike box on the
 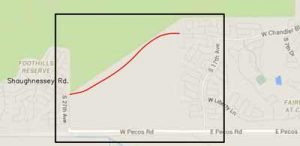 When the final portion of the Loop 202 / South Mountain Freeway (SMF), the part that connects I-10 to Laveen, gets constructed it will replace Pecos Road. Pecos Road in Ahwatukee will be no more. This would otherwise leave everything west of 19th Avenue inaccessible from the rest of Ahwautkee, except for the freeway. The construction of SMF is supposed to begin summer 2016 and opens late 2019.


 Pucher has the same or similar table comparing fatalities/injuries for NL, DK, GER, UK, USA (fig 2.6); i’m sort of confused by the injury rate calculations as
