Arizona Crash Facts 2022

No new thumbnail for 2022!

ADOT released Crash Facts 2022  July 24, 2023, which is back to the normal schedule (last year’s was released in late Sept for unstated reasons).

2022 was, again, a very bloody year on Arizona’s roads and highways. Overall deaths increased over the already bad 2020, and 2021 figures. Continue reading “Arizona Crash Facts 2022”

Arizona Crash Facts 2021

ADOT released Crash Facts 2021  in late September 2022 (a bit later than usual? and oddly, the database was missing a lot as recently as end of June; what is causing these huge delays? are police sitting on reports?

2021 was a very bloody year on Arizona’s roads and highways. 2020 had unusual traffic patterns due to pandemic [1], but comparing 2019 to 2021  deaths were up sharply for all person types (driver, passenger, bicyclists, pedestrian), about 20% overall. Continue reading “Arizona Crash Facts 2021”

2022 Preliminary Arizona Traffic Crash Stats

[UPDATE: yes, this is wrong wrong wrong. 2022 was in fact a terrible, bad, worse year; see Arizona Crash Facts 2022 ]

This is a warning about preliminary data and drawing stats from it… there was a news article “Arizona traffic fatalities are down in 2022, data shows” that was suggesting that 2022 might be on-track for significantly fewer traffic fatalities:

After a deadlier than usual year for traffic deaths in 2021, fatalities in 2022 showed a sharp decrease, according to preliminary data from the Arizona Governor’s Office of Highway Safety.
According to the preliminary data from the office, traffic fatalities between January and June fell from 626 deaths in 2021 to 350 deaths in 2022 — a 44% decrease.

Sadly, this is unlikely to be true. Continue reading “2022 Preliminary Arizona Traffic Crash Stats”

Arizona Crash Facts 2020

ADOT has released Crash Facts 2020 mid-year 2021, as usual. As was the case since 2018; I no longer need to order CDs but rather access the raw data online, in this case August 2021 (in very rare cases, the data will be updated after that).

Crashes were down dramatically due to pandemic’s affect on traffic

The Bicyclist Fatality Grid has been reconciled and contains some specifics on every bicyclist fatality in Arizona from 2009-2020, and ongoing as discovered. Continue reading “Arizona Crash Facts 2020”

Arizona Crash Facts 2018

ADOT has released Crash Facts 2018 in the later part of June (of 2019), as usual; this year and I did not order CDs but rather accessed the raw data online sometime in July (it will in relatively rare cases be updated after this).

The graphical crash map has been NOT updated and so continues to have years 2009-2017 ; the tool used to present the map, Google fusion tables, is being discontinued end of 2019, and I need to find a replacement.

The Fatality Grid has been reconciled and contains some specifics on every bicyclist fatality in Arizona from 2009-2018, and ongoing as discovered.

Continue reading “Arizona Crash Facts 2018”

Arizona Crash Facts 2017

ADOT has released Crash Facts 2017 in mid-year 2018 as usual; I received the database from them sometime in late August, as usual on a burned CD.

The graphical crash map has been updated and now contains 2009-2017 for both MV-bike and MV-ped crashes.

The Fatality Grid has been reconciled and contains some specifics on every bicyclist fatality in Arizona from 2009-2017 Continue reading “Arizona Crash Facts 2017”

Number and Severity of Arizona bike-MV crashes

[quick update on 2021 Crash Facts data — the pattern continues, the total number of reported cyclist crashes was only 1025. Notwithstanding a historically high fatality count of 43]

[at some point, ADOT began “scrubbing” PDO. As explained in the 12th Edition of the crash from instructions, linked here, effective 8/2019 AZ law bumped up the PDO reporting threshold from $1,000 to $2,000. As can be seen easily at the spreadsheet linked at Crash Facts 2021,  No-injury (and unknown injury) reports became exactly zero commencing with 2019).
In any event the PDO change would not explain all or even most of the dramatic decrease in reported non-fatal bicyclist crashes]

TL;DR? Here’s the bottom line:
Something suspicious is happening in 7 larger cities in Arizona ( ‘Chandler’, ‘Flagstaff’, ‘Glendale’, ‘Gilbert’, ‘Mesa’, ‘Scottsdale’, ‘Tempe’). That’s mostly the largest cities in AZ, excluding Phoenix and Tucson. In these 7 places, reported low-severity bike-MV crashes have decreased dramatically comparing before versus after 2014; suggesting some sort of policy change.[and note: the PDO limit issue of 2019, explained immediately above, doesn’t explain it, either]

It’s been noted that the number of reported Bike-MV crashes reported by police in Arizona have seen a mysterious sharp decrease; even as the number of MV crashes in general has risen. In round numbers through the 2009-2016 (some of the tables below have been updated to add 2017 & 2018) period, Bike-MV crashes have fallen by about a third, while MV crashes overall have increased by 20%. This time period covers the economic downturn following the Financial Crisis of 2008 and subsequent recovery. That trend has been used to explain the MV crash rate; but it doesn’t seem to have anything to do with Bike-MV rates; which would logically rise with more traffic and more (MV) traffic crashes.

Fewer crashes would be a good thing of course, but it feel like there’s something else going here. Also, the number of fatalities, while statistically small,  remained relatively flat but above their longer-term trend of 24 (rolling 10 yr average 2007-2016; refer to internal spreadsheet \crashReports\asdm\AZstats.xls)

Number of Arizona bike-MV crashes 2009-2019

Year Bike-MV all MV
2009 2000 107095
2010 1912 106301
2011 1910 103423
2012 2121 103176
2013 2039 107374
2014 1742 109553
2015 1434 116609
2016 1476 126845
2017 1496 127508
2018 1282 127133
2019 1256 128006
2020 830 * 98827 *
2021 1025 121222
2022 1159 (from Crash Facts) 119,921 (from crash facts)
2023

*  presumably depressed from pandemic, explored more here.

Continue reading “Number and Severity of Arizona bike-MV crashes”

Arizona Crash Facts 2016

ADOT has released Crash Facts 2016 in the later part of June (of 2016), a bit later than normal; and I received the database from them sometime in July.

The graphical crash map has been updated and now contains 2009-2016 for both MV-bike and MV-ped crashes.

The Fatality Grid has been reconciled and contains some specifics on every bicyclist fatality in Arizona from 2009-2016

Continue reading “Arizona Crash Facts 2016”

Total VMT and fatalities are up

Figure1-492x328

[mid/late 2016 NSC estimates for fatalities are up big-time over 2015]

As a follow on to last week’s story about how Arizona 2015 traffic fatalities are up by at least 15% …

Preliminary data prepared by the NSC shows traffic fatalities nationally are expected to be up 10% (though an AP story says 8%) . And FHWA preliminary data shows total VMT (Vehicle Miles Traveled) will increase to 3.1T miles, compared with 3T in 2014; (so perhaps a 3.5% increase). Continue reading “Total VMT and fatalities are up”

Arizona Motor Vehicle Fatalities increase in 2015

Preliminary data from ADOT shows a notable increase in traffic fatalities in 2015. At present the preliminary toll is 891 for 2015 — but is expected to rise as final reports trickle in — compared to 773 deaths in 2014. That would be a 15% increase.

There is no, not even a preliminary, breakdown by person type (driver, pedestrian, bicyclist, etc)… which seems odd. VERY preliminary bicyclist traffic fatality data for 2015 can be found at fatality-grid; but those numbers (presently 18 bicyclists) are guaranteed to be low because ADOT hoards the data for themselves, so it’s just whatever I came across in newspapers and word-of-mouth.

Also see report-phx-metro-freeway-crashes-dramatically-increase-in-2015 from a couple of weeks ago ; which noted that the number of crashes on Maricopa county freeways had increase even more dramatically, 23%, year-over-year.

Continue reading “Arizona Motor Vehicle Fatalities increase in 2015”

Report: Phx metro freeway crashes dramatically increase in 2015

The headline is the paper reads Report: DPS, ADOT clearing crashes faster on Maricopa County freeways but a factiod reveals later in the article should have been noted, my emphasis “Despite a 23 percent increase in freeway crashes“. This is a huge year-over-year increase. Why? If you read the actual press releases, it mentions the period is the first nine months of 2014 vs. 2015. yikes.

Continue reading “Report: Phx metro freeway crashes dramatically increase in 2015”

Arizona Crash Facts 2013

[ update early 2015; There are two discrepencies compared to the Crash Facts (which is still reporting 30 bicyclist fatalities at the time of this writing in Feb 2015); This will probably not be reconciled until the final FARS for 2013 is released, typically in very late 2015.  I have noted them both on the 2013 fatality grid (follow for links to news reports).  Both occurred in Lake Havasu City; which is a very peculiar. The first “missing” fatal occurred on 3/6/2013 and is present in FARS, but not asdm. This may be related to a 3/11 fatality, also in Lake Havasu City which is in both FARS and asdm.

I found a second discrepancy while googling around to find info about the 3/6/2013 fatal; so according to that there was a bicyclist fatality in the wee hours of 7/29/2013 involving a dui motorist. there’s all sorts of news coverage, the victim’s mother is on LHC city council. The driver quickly plead guilty to manslaughter and was sentenced. THIS IS NOT IN EITHER THE ASDM OR FARS!?

Also note that as of the time of this writing (early 2015) the so-called “final” FARS for 2013 hasn’t been released yet — it normally comes out in December (of 2015, for 2013). And I only have visibility into the asdm data that adot puts out on a dvd issued in June (of 2014 for the year 2013 crashes)]

Adot has released Crash Facts 2013 in early June, as usual/expected. The graphical crash map has been updated. The overall figures were relatively flat, the overall numbers of MV crashes of all types (all figures are year-over-year; 2012 vs. 2013):

  • number of MV crashes: 103,909 vs. 107,348 up 3.31%
  • all Fatalities: 821 vs.  844. up 2.80%
  • Total Injuries: 50,051 vs. 50,284 almost flat at up 0.47%

The two most closely-watched traffic safety metrics, the number of fatalities per 100M Vehicle Miles Traveled (VMT), and per 100K population are not yet available but will remain ~ 20% worse for Arizonans than for the US overall.

The results for cyclists were somewhat mixed —

  • the number of bike-MV crashes:  2,149 vs. 2,039. down 5%
  • number of cyclists injured: 1,766 vs. 1,679 down 5%
  • The number of fatalities at 30 was far higher than the last year’s 18 — the average yearly toll has been about 24; 30 is atypically high and 18 was atypically low. Fatalities, being relatively rare, have quite wide variation, making it hard to discern trends. For example in the most recent 10 year period there have been as many as 36 (in 2005) and as few as 18 (last year).

Longer term trends

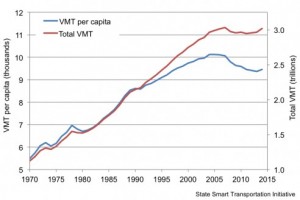
I have a spreadsheet that tracks  # of cyclist injuries and fatalities for 2001-2013. The number of cyclists injured this past year, 1,679, is almost exactly at the 13-year average of 1,655; and hasn’t much varied in 13 years. We still have no good exposure data; though we can say in that time, the population of AZ has grown 24% and driving has increased 19%.  AzStats.xls (current as of 2014 data) or on google drive (the google drive version is quite possibly out of date).

Every Bicyclist Counts

I have been critical of the way the data from a recent LAB report, Every Bicyclist Counts, has been used. There is one issue, however where I am in complete agreement with LAB. The EBC used media reports and word-of-mouth to compile a list — much the same way as I do for Arizona; as of today, I am only aware of 12 Arizona bicyclist fatalities for 2013; but I now know there have been 30, so the majority are “missing”(!).  You can view the list of Arizona cyclists killed since 2009 at that same link — if you have any further information; please pass it along.  For years before 2013 the list is complete; but some victims are just placeholders, known to me only because of the crash databases.

Why are there such large gaps in media coverage?

ASDM

The Arizona/Adot Safety Data Mart database (which is what i call it; i’m not sure if the CD adot sells for $15+2 is identical to that or not, but it is apparently pretty close). The CD became available mid-June on schedule and is all loaded up.

Below are some queries that match exactly “Crash Facts” for cyclists crashes/people injured, e.g. in 2013 (see chart on p.41).
Note that injury=2,3 or 4 counts Possible Injury, Injury, and incapacitating injury. The other choices are 1=No injury, 5=fatality, and (in the person table only) 99=Unknown, and somehow the unknowns always end up being no injury according to the incident table. (On spreadsheet AZstats.xls there’s a worksheet from Mike S that tallies numbers for cyclists and peds back to 2001). To count number of cyclist crashes and people, respectively:

SELECT eInjurySeverity,count(1) FROM 2013_incident i WHERE EXISTS (SELECT 1 FROM 2013_person p WHERE p.IncidentID=i.IncidentID AND p.ePersonType IN ('PEDALCYCLIST')) GROUP BY 1 ;

SELECT eInjuryStatus, count(1) from 2013_person where PersonType=3 group by 1;

Results for 2013: 2039, and 2071

To count number cyclist crashes w/injury, and number of injured cyclists:

SELECT count(1) FROM 2013_incident i WHERE EXISTS (SELECT 1 FROM 2013_person p WHERE p.IncidentID=i.IncidentID AND p.ePersonType IN ('PEDALCYCLIST')) AND InjurySeverity IN (2,3,4);
SELECT count(*) from 2013_person where ePersonType LIKE 'PEDAL%' AND InjuryStatus IN (2,3,4) ;

results for 2013: 1669 and 1679

Brief Remarks on 2014 Crash Facts

From Page 1 of 2014 Crash Facts; of the 884 total persons killed in Arizona traffic crashes:

  • Motorists: 589 (= 425 drivers + 164 passengers)
  • Pedestrians: 157
  • Pedalcyclists: 28

.

Arizona Road Deaths Increase — 2011 data

ADOT recently released 2011 Crash Facts.

In summary: The overall traffic death toll bounced up after several years of significant declines. The number of fatalities is up 9% year-over-year, despite a 3% decrease in the number of crashes.

Year over year: ped injuries and fatalites were nearly flat; bicyclist injuries were also nearly identical. There were 23 cyclists killed in 2011 (versus 19 in 2010)

Here’s a news piece: azcentral.com/news/articles/20120816arizona-road-deaths-increase It has a graph of fatals per 100million VMT which appears to be drawn wrong; for example line chart shows Arizona’s virtually on top of the overall-US figure for 2009, and 2010 but that’s not correct; although in recent years Arizona has been closing the gap, it remains markedly higher than overall-US:

2009: 1.14 vs. 1.31

2010: 1.11 vs. 1.27

It’s a pretty small graph but it’s clearly not right — the Arizona Line is drawn incorrectly for those two years.