Missing 2013 and 2014 Fatalities

A note about data sources

  • FARS. As of this writing the 2013 final is available, and 2014 is preliminary
  • Arizona Crash Facts; published yearly by ADOT in June of the following year
  • ADOT collision database sometimes called ASDM (I’ll refer to it as that, below); released yearly in June of the following year
  • News / Media reports; obviously this is very incomplete and hit-and-miss

Data from all these sources is located centrally on this google docs spreadsheet. which covers each bicyclist fatality occurring from 2009 onward.

Normally these are all in agreement, however there are multiple inconsistencies in both 2013 and 2014 that I cannot resolve. Continue reading “Missing 2013 and 2014 Fatalities”

Total VMT and fatalities are up

Figure1-492x328

[mid/late 2016 NSC estimates for fatalities are up big-time over 2015]

As a follow on to last week’s story about how Arizona 2015 traffic fatalities are up by at least 15% …

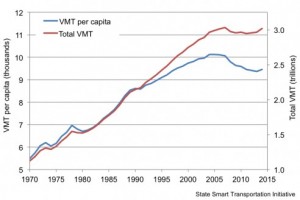
Preliminary data prepared by the NSC shows traffic fatalities nationally are expected to be up 10% (though an AP story says 8%) . And FHWA preliminary data shows total VMT (Vehicle Miles Traveled) will increase to 3.1T miles, compared with 3T in 2014; (so perhaps a 3.5% increase). Continue reading “Total VMT and fatalities are up”

Arizona Motor Vehicle Fatalities increase in 2015

Preliminary data from ADOT shows a notable increase in traffic fatalities in 2015. At present the preliminary toll is 891 for 2015 — but is expected to rise as final reports trickle in — compared to 773 deaths in 2014. That would be a 15% increase.

There is no, not even a preliminary, breakdown by person type (driver, pedestrian, bicyclist, etc)… which seems odd. VERY preliminary bicyclist traffic fatality data for 2015 can be found at fatality-grid; but those numbers (presently 18 bicyclists) are guaranteed to be low because ADOT hoards the data for themselves, so it’s just whatever I came across in newspapers and word-of-mouth.

Also see report-phx-metro-freeway-crashes-dramatically-increase-in-2015 from a couple of weeks ago ; which noted that the number of crashes on Maricopa county freeways had increase even more dramatically, 23%, year-over-year.

Continue reading “Arizona Motor Vehicle Fatalities increase in 2015”

Report: Phx metro freeway crashes dramatically increase in 2015

The headline is the paper reads Report: DPS, ADOT clearing crashes faster on Maricopa County freeways but a factiod reveals later in the article should have been noted, my emphasis “Despite a 23 percent increase in freeway crashes“. This is a huge year-over-year increase. Why? If you read the actual press releases, it mentions the period is the first nine months of 2014 vs. 2015. yikes.

Continue reading “Report: Phx metro freeway crashes dramatically increase in 2015”

Traffic Safety Facts: Bicyclists and Other Cyclists

[Update: this article was written way back in 2011; since then i continued to update links to the yearly Publication; the 2020 data is currently most recent as of June 2023]

Each year, the USDOT, NHTSA (United States Dept of Transportation / National Highway Traffic Safety Administration) issues a report called Traffic Safety Facts: Bicyclists and Other Cyclists xxxx. The report comes out about 18 months after the close of the calendar year under review. Continue reading “Traffic Safety Facts: Bicyclists and Other Cyclists”

Use of alcohol as a risk factor for bicycling injury

Skip below if you’ve visited this page specifically to see the Johns Hopkins’ study.

FARS Alcohol Results

The FARS data has a number of alcohol (and drug) fields — the fields ATST_TYP, ALC_RES relate actual test type, and results. To simplify things, I’ve added a derived field sALC_RES to breaks down test results into: negative, .01 through .07, and .08+, or no results. Most fatally injured drivers, cyclists, and pedestrians do get tested. (for those that are not, there are imputed results available from a separate data file, see below).

Note that the ALC_RES field, the numerical result, has changed over the years, before 2015, it was listed as the number of hundredths of a percent BAC, e.g. 0.12 was coded as 12. In 2015 and later, it is coded as thousandths of a percent BAC, so the same result would be listed at 120.  The logic for this is encapsulated in the file 20xx_person.sql in the synthetic value sALC_RES: intox / not intox.

FARS and Drug Testing

The coding for drug results in FARS is similar to the alcohol scheme, except there are no quantitative results, only positive/negative. Also there is no equivalent to the imputation of results for drugs.

FARS coding: positive results for drugs shows up in the field DSTATUS=2 (i.e. “test given”) and DRUGRES1, 2, or 3 have a number up to 999; all in the person table. 0 meand test not given; 1 means No Drugs Reported/Negative. Potentially illicits are in groups generally in hundreds, e.g. 100-295 are narcotics, 300’s are depressants, 600’s cannaboids.  Anything 996 or above are various meanings for unknown.

Examples: Zolpidem (Ambien) is 375. See pages 579-594 of the FARS Coding and Validation Manual.

FARS and Imputation of Alcohol Results

Driving while intoxicated has been recognized as a significant serious safety factor for decades; at the same time, it’s long been recognized that many involved in fatal traffic collisions (mostly drivers but sometimes peds and bicyclists) do not have recorded alcohol test results. This nhtsa report published in 2002 explains most of the deep background and terminology on the scheme to “fill in” missing results: Continue reading “Use of alcohol as a risk factor for bicycling injury”

Arizona Crash Facts 2013

[ update early 2015; There are two discrepencies compared to the Crash Facts (which is still reporting 30 bicyclist fatalities at the time of this writing in Feb 2015); This will probably not be reconciled until the final FARS for 2013 is released, typically in very late 2015.  I have noted them both on the 2013 fatality grid (follow for links to news reports).  Both occurred in Lake Havasu City; which is a very peculiar. The first “missing” fatal occurred on 3/6/2013 and is present in FARS, but not asdm. This may be related to a 3/11 fatality, also in Lake Havasu City which is in both FARS and asdm.

I found a second discrepancy while googling around to find info about the 3/6/2013 fatal; so according to that there was a bicyclist fatality in the wee hours of 7/29/2013 involving a dui motorist. there’s all sorts of news coverage, the victim’s mother is on LHC city council. The driver quickly plead guilty to manslaughter and was sentenced. THIS IS NOT IN EITHER THE ASDM OR FARS!?

Also note that as of the time of this writing (early 2015) the so-called “final” FARS for 2013 hasn’t been released yet — it normally comes out in December (of 2015, for 2013). And I only have visibility into the asdm data that adot puts out on a dvd issued in June (of 2014 for the year 2013 crashes)]

Adot has released Crash Facts 2013 in early June, as usual/expected. The graphical crash map has been updated. The overall figures were relatively flat, the overall numbers of MV crashes of all types (all figures are year-over-year; 2012 vs. 2013):

  • number of MV crashes: 103,909 vs. 107,348 up 3.31%
  • all Fatalities: 821 vs.  844. up 2.80%
  • Total Injuries: 50,051 vs. 50,284 almost flat at up 0.47%

The two most closely-watched traffic safety metrics, the number of fatalities per 100M Vehicle Miles Traveled (VMT), and per 100K population are not yet available but will remain ~ 20% worse for Arizonans than for the US overall.

The results for cyclists were somewhat mixed —

  • the number of bike-MV crashes:  2,149 vs. 2,039. down 5%
  • number of cyclists injured: 1,766 vs. 1,679 down 5%
  • The number of fatalities at 30 was far higher than the last year’s 18 — the average yearly toll has been about 24; 30 is atypically high and 18 was atypically low. Fatalities, being relatively rare, have quite wide variation, making it hard to discern trends. For example in the most recent 10 year period there have been as many as 36 (in 2005) and as few as 18 (last year).

Longer term trends

I have a spreadsheet that tracks  # of cyclist injuries and fatalities for 2001-2013. The number of cyclists injured this past year, 1,679, is almost exactly at the 13-year average of 1,655; and hasn’t much varied in 13 years. We still have no good exposure data; though we can say in that time, the population of AZ has grown 24% and driving has increased 19%.  AzStats.xls (current as of 2014 data) or on google drive (the google drive version is quite possibly out of date).

Every Bicyclist Counts

I have been critical of the way the data from a recent LAB report, Every Bicyclist Counts, has been used. There is one issue, however where I am in complete agreement with LAB. The EBC used media reports and word-of-mouth to compile a list — much the same way as I do for Arizona; as of today, I am only aware of 12 Arizona bicyclist fatalities for 2013; but I now know there have been 30, so the majority are “missing”(!).  You can view the list of Arizona cyclists killed since 2009 at that same link — if you have any further information; please pass it along.  For years before 2013 the list is complete; but some victims are just placeholders, known to me only because of the crash databases.

Why are there such large gaps in media coverage?

ASDM

The Arizona/Adot Safety Data Mart database (which is what i call it; i’m not sure if the CD adot sells for $15+2 is identical to that or not, but it is apparently pretty close). The CD became available mid-June on schedule and is all loaded up.

Below are some queries that match exactly “Crash Facts” for cyclists crashes/people injured, e.g. in 2013 (see chart on p.41).
Note that injury=2,3 or 4 counts Possible Injury, Injury, and incapacitating injury. The other choices are 1=No injury, 5=fatality, and (in the person table only) 99=Unknown, and somehow the unknowns always end up being no injury according to the incident table. (On spreadsheet AZstats.xls there’s a worksheet from Mike S that tallies numbers for cyclists and peds back to 2001). To count number of cyclist crashes and people, respectively:

SELECT eInjurySeverity,count(1) FROM 2013_incident i WHERE EXISTS (SELECT 1 FROM 2013_person p WHERE p.IncidentID=i.IncidentID AND p.ePersonType IN ('PEDALCYCLIST')) GROUP BY 1 ;

SELECT eInjuryStatus, count(1) from 2013_person where PersonType=3 group by 1;

Results for 2013: 2039, and 2071

To count number cyclist crashes w/injury, and number of injured cyclists:

SELECT count(1) FROM 2013_incident i WHERE EXISTS (SELECT 1 FROM 2013_person p WHERE p.IncidentID=i.IncidentID AND p.ePersonType IN ('PEDALCYCLIST')) AND InjurySeverity IN (2,3,4);
SELECT count(*) from 2013_person where ePersonType LIKE 'PEDAL%' AND InjuryStatus IN (2,3,4) ;

results for 2013: 1669 and 1679

Brief Remarks on 2014 Crash Facts

From Page 1 of 2014 Crash Facts; of the 884 total persons killed in Arizona traffic crashes:

  • Motorists: 589 (= 425 drivers + 164 passengers)
  • Pedestrians: 157
  • Pedalcyclists: 28

.

Is it really 20 times more dangerous?

I’ve been seeing, more often lately it seems, fairly bold numerical statements about relative bike traffic safety; so to take this one from peopleforbikes for example (my emphasis added): “The problem is particularly glaring here in the United States, where bike injury and fatality rates are roughly 20 times those of the cycling-friendly countries of western Europe“. Continue reading “Is it really 20 times more dangerous?”

Arizona Bicyclist and Ped Crash Map

Volunteer Needed

crashmap

URGENT: Google has announced the tool used to present the crash maps, below, called “Fusion Tables” is being discontinued Dec 3, 2019.
Azbikelaw is looking for a volunteer familiar with GIS and web-presentation to help effect transition to something else.

Please see this article for more info. Below is the historical data and procedures.

Continue reading “Arizona Bicyclist and Ped Crash Map”

Collision Manner

[Warning/correction not yet made: in the table below where it says MV-only, that’s not quite correct, it’s really incidents where no pedalscylists are involved. The MV-only calculations should also exclude pedestrians; this can be accomplished by saying u.eUnitType LIKE ‘PED%’  In the query below i corrected it but didn’t correct the table; the percentages don’t really change since there are relatively few ped crashes ]

Here is a breakdown of Collision Manner, and rates, for MV collisions (i.e. one or more MV, and not involving a ped or bicyclists) compared to bike-MV collisions.

The megatrends are that rear end collisions are, by far, the predominant manner of collision for MVonly crashes; wheres for bike-MV crashes this manner is quite infrequent — almost twelve times more frequent. For bike-MV crashes, the predominant manner is angle, i.e. so called “turning and crossing” movements (although left turn is broken out as a separate manner).

The 38% rate of REAR END crashes for MVs actually understates the rate — if you back out the number of SINGLE VEHICLE crashes; you see that nearly half of all multi-car collisions are REAR END(!). 38,499/(101,055 – 18,647) = 47%. Inattention? Does this mean that motorists actually are more attentive to same-direction traffic when it’s a bicyclist, compared to another motorist? hmmm.

+------------------------------+-------+--------+------+--------+-------------+
| eCollisionManner             | MVonly| MVrate |bikeMV|bikerate|MV:bike ratio|
+------------------------------+-------+--------+------+--------+-------------+
| REAR_TO_REAR                 |   287 | 0.0028 | NULL |   NULL |        NULL |
| UNKNOWN_99                   |   859 | 0.0085 |   40 | 0.0189 |  0.44973545 |
| REAR_TO_SIDE                 |   895 | 0.0089 |   11 | 0.0052 |  1.71153846 |
| SIDESWIPE_OPPOSITE_DIRECTION |  1244 | 0.0123 |   46 | 0.0217 |  0.56682028 |
| HEAD_ON                      |  1438 | 0.0142 |   45 | 0.0212 |  0.66981132 |
| OTHER_97                     |  3160 | 0.0313 |  404 | 0.1905 |  0.16430446 |
| SIDESWIPE_SAME_DIRECTION     | 10727 | 0.1062 |  124 | 0.0585 |  1.81538462 |
| LEFT_TURN                    | 11888 | 0.1176 |  189 | 0.0891 |  1.31986532 |
| ANGLE_FRONT_TO_SIDE          | 13411 | 0.1327 | 1194 | 0.5629 |  0.23574347 |
| SINGLE_VEHICLE               | 18647 | 0.1845 | NULL |   NULL |        NULL |
| REAR_END                     | 38499 | 0.3810 |   68 | 0.0321 | 11.86915888 |
+------------------------------+-------+--------+------+--------+-------------+
total num of MVonly crashes = 101,055.  total num of bike-MV crashes = 2,121
source: 2012 ASDM

Continue reading “Collision Manner”

Arizona road-safety focus switches to pedestrians

… or so says the headline. Arizona road-safety focus switches to pedestrians, by Jim Walsh, The Arizona Republic Oct 11, 2012.

The article looks at the uncomfortable truth in Arizona traffic crash stats — that ped rates appear to have gotten worse even as MV rates have fallen (see ‘Disturbing Trend?’ here). The article neglects to mention that Arizona trends worse than average in overall (overall US; and overall counting motorist, pedestrian and bicyclist) traffic fatalities.

Why is Phoenix Dangerous by Design? As I pointed out when the 2010 Arizona statistics came out: “there were more bicyclists killed within the City of Phoenix (9) than were killed in the entire state of Massachusetts(6)”; it appears that Arizona/Phoenix values building out more ultra-wide (lots of lanes), ultra-fast (speeds 40mph AND UP). These car sewers are not conducive to human life; and that goes for not only pedestrians but for bicyclists and motorists as well. This is also the gist of the paper/article Beyond Safety in Numbers: Why Bike Friendly Cities are Safer.

To complete the factoid: Nearly as many pedestrians were killed in the city of Phoenix (45) than in the entire state of Massachusetts (56) in 2010. (sources: City of Phoenix 2010 Traffic Collision summary; NHTSA State Traffic Safety Information for the year 2010).

We’re doing something horribly wrong here in Arizona.

To Continue The Theme…

A more recent article then appeared a couple of weeks later  Pedestrian vs. vehicle fatalities alarm police, By Cecilia Chan, The Arizona Republic,  Nov 12, 2012.

There’s a bit of undertone from certain parties that this is largely a pedestrian problem, e.g. Phoenix police spokesman James Holmes said. “Lots of accidents are midblock”. There are a couple of problems with this attitude — one is that with long blocks (the norm on Phoenix’s arterial streets), traffic both speeds up, and there is simply more mid-block (that is to say, it becomes increasingly unreasonable for a pedestrian to walk out of their way to a crosswalk).

Setting all that aside, reading on we find that (only)” Thirty percent of the fatal pedestrian collisions in 2010 were the result of the pedestrian not using a crosswalk”, and “In 49 percent of the fatal collisions, the driver was not at fault”. Which is to say: 70 percent of peds in collisions were using a crosswalk, and right around half the time the ped is at fault (even under the laws, that clearly fault peds over motorists, particularly at mid-block), and the other half the time the motorist was at fault.


Arizona Road Deaths Increase — 2011 data

ADOT recently released 2011 Crash Facts.

In summary: The overall traffic death toll bounced up after several years of significant declines. The number of fatalities is up 9% year-over-year, despite a 3% decrease in the number of crashes.

Year over year: ped injuries and fatalites were nearly flat; bicyclist injuries were also nearly identical. There were 23 cyclists killed in 2011 (versus 19 in 2010)

Here’s a news piece: azcentral.com/news/articles/20120816arizona-road-deaths-increase It has a graph of fatals per 100million VMT which appears to be drawn wrong; for example line chart shows Arizona’s virtually on top of the overall-US figure for 2009, and 2010 but that’s not correct; although in recent years Arizona has been closing the gap, it remains markedly higher than overall-US:

2009: 1.14 vs. 1.31

2010: 1.11 vs. 1.27

It’s a pretty small graph but it’s clearly not right — the Arizona Line is drawn incorrectly for those two years.


ADOT Traffic Collision Database

ACIS — Arizona Crash Information System; was ASDM?

It turns out (who knew?) that ADOT sells their crash database for a nominal sum. I purchased the 2010 version, the latest full-year available (2011 is supposed to be ready in July). This data is either similar to (or synonymous with) something referred to as the Arizona (or ADOT?) Safety Data Mart — thus the acronym asdm sprinkled throughout. Continue reading “ADOT Traffic Collision Database”